
C言語のプログラムで,パイプを開いて,それをGnuplotに接続する方法を説明する。 これには次の方法が必要である。
1.パイプを開く
2.パイプを通してコマンドを送る
3.パイプを閉じる
1.パイプを開くためには,ファイルポインターをつかう. そのためファイルポインターを格納すの変数を用意しなくてはならない. パイプの先もファイルとして扱われるのである.
FILE *hoge;
2.Gnuplotを立ち上げて,そこにパイプを接続する必要がある. パイプの情報のファイルポインターで示される.
hoge = popen("gnuplot -persist","w");
popen()関数がパイプを開く命令であり、 これで Gnuplot が立ち上がり,パイプを通して,コマンドを送ることができる. またパイプを通して,Gnuplotにコマンドを送るのはfprintf()関数を使う.
fprintf(hoge, "plot sin(x)\n");
3.すべての動作が終了したならば,パイプを閉じなくてはならない. これはファイルの操作と全く同じである.
pclose(hoge);
例1.
#include <stdio.h>
#include <stdlib.h>
#include <math.h>
int main(int argc, char **argv)
{
FILE *gpid;
int i;
double x;
/* gnuplot を開く */
gpid = popen("gnuplot -persist","w");
/* gnuplot でグラフを書く */
for(i=1; i < 500; i++){
fprintf(gpid, "set xrange [0:4]\n");
fprintf(gpid, "set yrange [-1:1]\n");
x = 0.03*i;
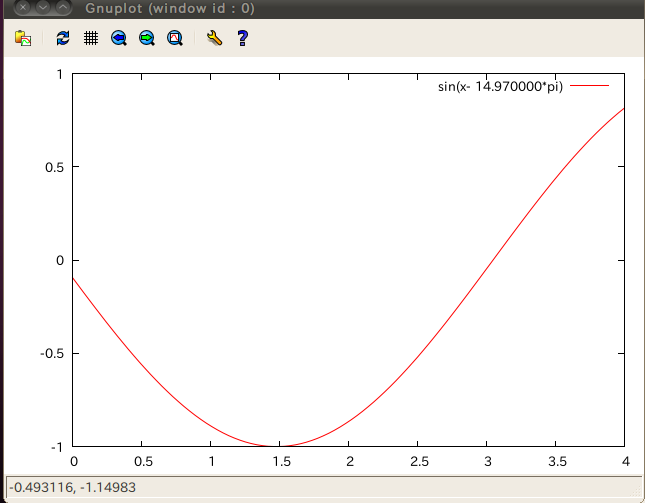
fprintf(gpid,"plot sin(x- %f*pi)\n",x);
}
fprintf(gpid, "pause 10\n");
pclose(gpid);
return 0;
}
[出力結果]
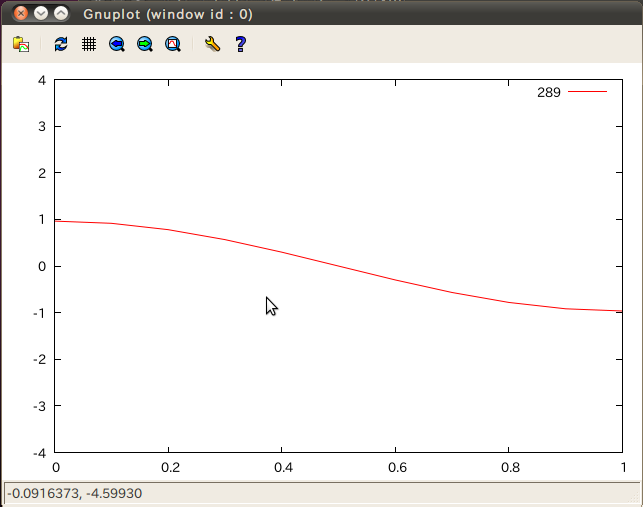
例2.
#include <stdio.h>
#include <stdlib.h>
int main(void)
{
FILE *gp;
int i;
double x;
//---Gnuplotを起動---
gp = popen("gnuplot -persist", "w");
//---座標の名前を入力---
fprintf(gp, "set xlabel \"x\"\n");
fprintf(gp, "set ylabel \"y\"\n");
for(i=1 ; i<=200 ; i++) {
x = 0.02 * i;
//---Gnuplotのコマンドを実行---
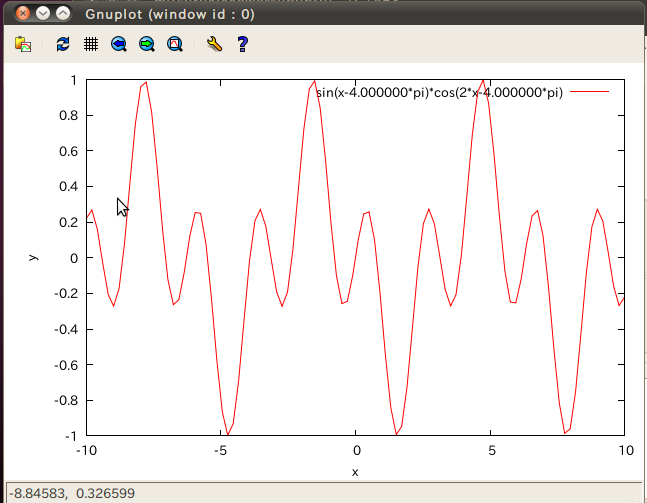
fprintf(gp, "plot sin(x-%f*pi)*cos(2*x-%f*pi)\n", x, x);
}
pclose(gp);
return (0);
}
[出力結果]
例3.
#include <stdio.h>
int main(void){
FILE *data, *gp;
int i, imax=20;
double x=-5.0, dx, y;
char *data_file;
/*------ データファイル作成 ---------- */
data_file="out.dat";
data = fopen(data_file,"w");
dx=10.0/imax;
for(i=0; i<=imax; i++){
if(x<-1){
y=-1.0;
}else{
y=1.0;
}
fprintf(data,"%f\t%f\n", x, y);
x+=dx;
}
fclose(data);
/*------ グラフの作成 ---------- */
gp = popen("gnuplot -persist","w");
fprintf(gp, "set xrange [-5:5]\n");
fprintf(gp, "set yrange [-1.5:1.5]\n");
fprintf(gp, "set pointsize 2\n");
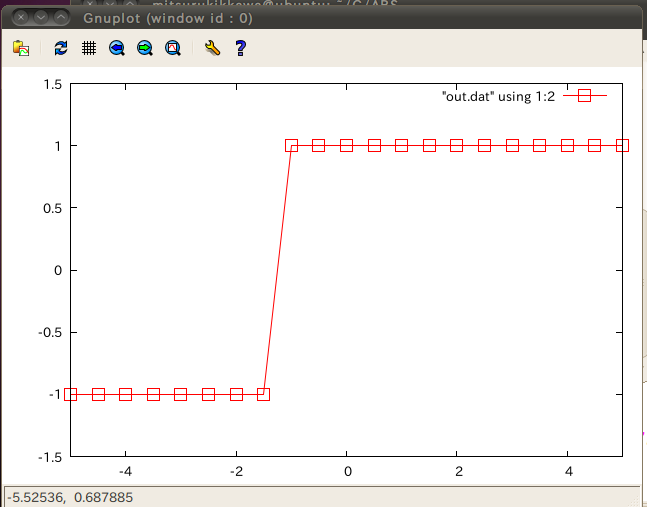
fprintf(gp, "plot \"%s\" using 1:2 with linespoints 1 4 \n", data_file);
pclose(gp);
return 0;
}
[出力結果]
例4.
#include <stdio.h>
#include <math.h>
void mk_triangle_data(char *a, double x1, double x2, int n);
void mk_graph(char *f, char *xlb, double x1, double x2,
char *ylb, double y1, double y2);
/*==========================================================*/
/* main function */
/*==========================================================*/
int main(void){
double pi = 4*atan(1);
mk_triangle_data("out.txt", -2*pi, 2*pi, 1000);
mk_graph("out.txt", "x", -2*pi, 2*pi, "y", -3, 3);
return 0;
}
/*==========================================================*/
/* make a data file */
/*==========================================================*/
void mk_triangle_data(char *a, double x1, double x2, int n){
double x, dx;
double y1, y2, y3;
int i;
FILE *out;
dx = (x2-x1)/n;
out = fopen(a, "w");
for(i=0; i<=n; i++){
x = x1+dx*i;
y1 = sin(x);
y2 = cos(x);
y3 = tan(x);
fprintf(out, "%e\t%e\t%e\t%e\n", x, y1, y2, y3);
}
fclose(out);
}
/*==========================================================*/
/* make a graph */
/*==========================================================*/
void mk_graph(char *f, char *xlb, double x1, double x2,
char *ylb, double y1, double y2)
{
FILE *gp;
gp = popen("gnuplot -persist","w");
fprintf(gp, "reset\n");
/* ------- set x grid ---------*/
fprintf(gp, "set grid\n");
/* ------- set x axis ---------*/
fprintf(gp, "set xtics 1\n");
fprintf(gp, "set mxtics 10\n");
fprintf(gp, "set xlabel \"%s\"\n", xlb);
fprintf(gp, "set nologscale x\n");
fprintf(gp, "set xrange[%e:%e]\n", x1, x2);
/* ------- set y axis ---------*/
fprintf(gp, "set ytics 1\n");
fprintf(gp, "set mytics 10\n");
fprintf(gp, "set ylabel \"%s\"\n", ylb);
fprintf(gp, "set nologscale y\n");
fprintf(gp, "set yrange[%e:%e]\n", y1, y2);
/* ------- plat graphs ---------*/
fprintf(gp, "set terminal x11\n");
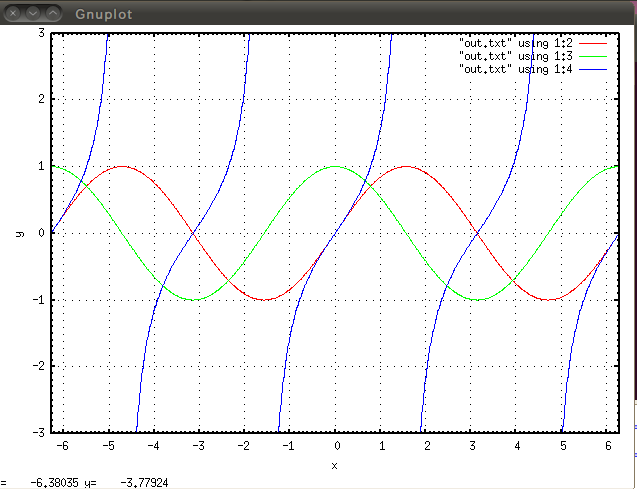
fprintf(gp, "plot \"%s\" using 1:2 with line,\
\"%s\" using 1:3 with line,\
\"%s\" using 1:4 with line\n", f, f, f);
fprintf(gp, "set terminal emf\n");
fprintf(gp, "set output \"tri.emf\"\n");
fprintf(gp, "replot\n");
pclose(gp);
}
[出力結果]
例5.
/*は熱方程式の近似解を陽解法により求めながら,GNUPLOT を用いて数値解を表示するプログラム*/

#include <stdio.h>
#include <stdlib.h>
#include <math.h>

#define dt 0.0005
#define N 10
#define T 1000

int main()
{
  double u[N+1], new_u[N+1];
  int i, j;
  double dx = 1. / (float)N;
  double r = dt / (dx * dx);

FILE *gpid;
/* gnuplot を開く */
if((gpid = popen("gnuplot -persist", "w")) == NULL) {
  printf("I can't find gnuplot.\n");
  exit(1);
}

/* y 方向の描画領域を固定 */
fprintf(gpid, "set yrange[-4:4]\n");
  for(i = 0; i <= N; i++){
   u[i] = 4 * cos(M_PI * i * dx);
}

for(j = 0; j < T; j++){
/* 熱方程式を陽解法で解く*/
for(i = 1; i < N; i++){
  new_u[i] = r * u[i - 1] + (1. - 2. * r) * u[i] + r * u[i + 1];
  }
   new_u[0] = 2. * r * u[1] + (1. - 2. * r) * u[0];
   new_u[N] = 2. * r * u[N - 1] + (1. - 2. * r) * u[N];
   for(i = 0; i <= N; i++){
   u[i] = new_u[i];
  }

/* gnuplot でグラフを描く */
   fprintf(gpid, "plot '-' w l t '%d'\n", j);
   for(i = 0; i <= N; i++){
   fprintf(gpid, "%lf %lf\n", i * dx, u[i]);
}

  fprintf(gpid, "e\n");
  fflush(gpid);
}
   fprintf(gpid, "pause 10\n");
  pclose(gpid);
  return 0;
}
[出力結果]
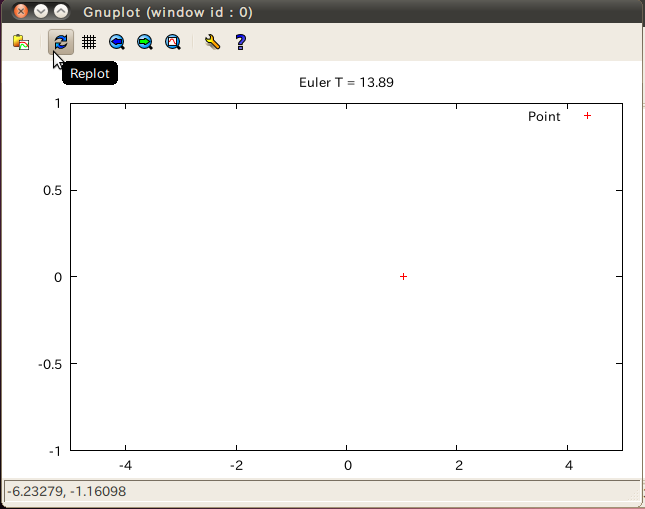
例6.
/*==================================================*/
// 単振動シミュレーション (Euler Method)
/*==================================================*/

#include <stdio.h>
#include <math.h>

#define TIME 50     // 終了時刻
#define DT   0.01   // 時間刻み

// Gnuplotによるアニメーション
void plotter(FILE* gp, double t, double x);

/*==================================================*/
//  微分方程式 (d/dt)^2{x} = -x
//  ↓
//  d/dt{x} = +v
//  d/dt{v} = -x
/*==================================================*/
double dxdt(double v) { return +v; }
double dvdt(double x) { return -x; }

int main(void)
{
  int    it;
  double x    = 0.0;                  // 初期位置
  double v    = 1.0;                  // 初期速度
  double t    = 0.0;                  // 現在時刻
  int    tmax = (int)ceil(TIME/DT);   // ループ回数
  FILE*  gp   = popen("gnuplot", "w");

  for(it = 1; it <= tmax; it++) {
    double x_old = x;
    double v_old = v;

    t = it*DT;
    x = x + DT*dxdt(v_old);
    v = v + DT*dvdt(x_old);

    plotter(gp, t, x);
  }

  fprintf(stderr, "End. Hit Return Key\n");
  getchar();
  pclose(gp);

  return 0;
}

void plotter(FILE* gp, double t, double x)
{
  fprintf(gp, "set title 'Euler T = %4g'\n", t);
  fprintf(gp, "set xrange[-5:5]\n");
  fprintf(gp, "set yrange[-1:1]\n");
  fprintf(gp, "plot '-' with points title 'Point'\n");
  fprintf(gp, "%g, %g\n", x, 0.0);
  fprintf(gp, "end\n");
  fflush(gp);
}
[出力結果]
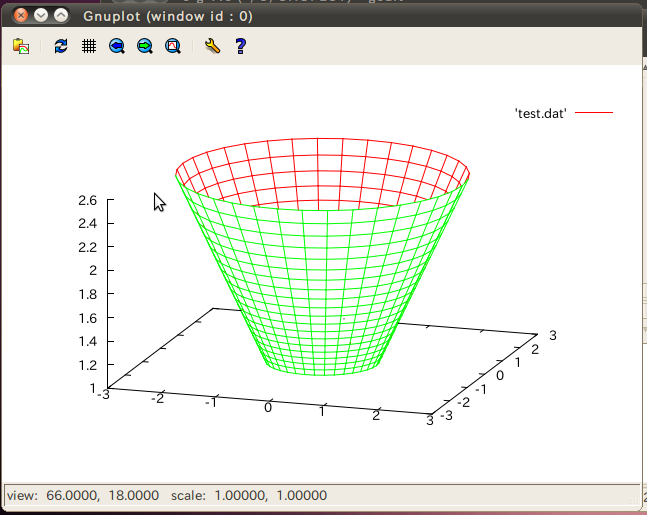
例7.
#include <stdio.h>
#include <stdlib.h>
#include <math.h>

int main(int argc, char **argv)
 {
  FILE *gid, *fid;
  int i,j;
  double x,y,z,t;
  char *data={"test.dat"};

  gid = popen("gnuplot","w");
  fid = fopen(data,"w");

  for (i=0; i<20; i++){
    z = exp(0.05*i);
    for(j=0; j<=36; j++){
       x = z*cos(M_PI/18*j);
       y = z*sin(M_PI/18*j);
       fprintf(fid,"%f %f %f\n",x,y,z);
       }
      fprintf(fid,"\n");
      }
      fclose(fid);

      fprintf(gid,"set hidden3d\n");
      fprintf(gid,"set ticslevel 0\n");
      for (i=0; i<=30 ;i++){
         fprintf(gid, "set view %d,%d,,\n",30+2*i, i);
         fprintf(gid, "splot '%s' w lines \n", data);
         fflush(gid);
         }
        fprintf(gid,"pause 3\n");
         pclose(gid);
}
[出力結果]
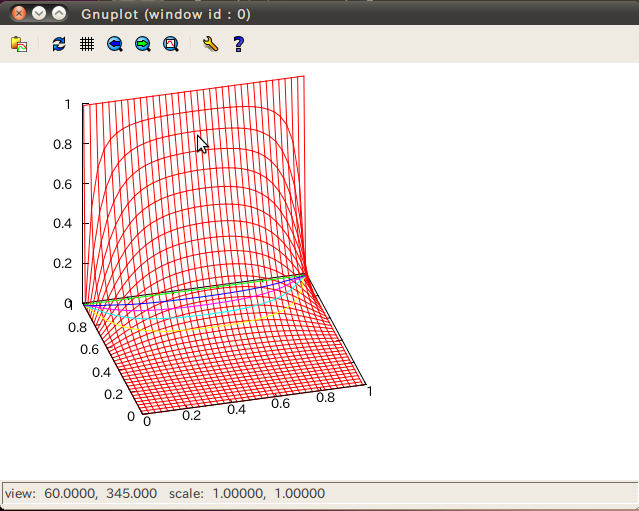
例8.
#include <stdio.h>
#include <stdlib.h>
#include <math.h>
#define DIV 71
#define INTERVAL 30

main(int argc, char **argv)
{
  FILE *gid;
  int i,j, gout;
  double cmax, corr, EPS=1e-5, u[DIV][DIV];
  double MESH=1.0/DIV;
     if (argc>2) EPS = atof(argv[1]);
     /* 境界条件*/
       for (i = 0; i < DIV; i++){
       for (j = 0; j < DIV; j++){
       u[i][j]=0.0;
       }
       }
       for (i = 0; i < DIV; i++) u[i][DIV-1]=1.0;
      /* for (j = 0; j < DIV; j++) u[DIV-1][j]=1.0; */
#ifdef V38I
     gid = popen("gnuplot","w");
     fprintf(gid,"set pm3d\n");
     fprintf(gid,"unset colorbox\n");
     fprintf(gid,"set palette rgb 8,2,8\n");
     fprintf(gid,"set size square\n");
#else
      gid = popen("gnuplot","w");
      fprintf(gid,"set size 0.7,1.1\n");
#endif
       fprintf(gid,"set view 60,345\n");
       fprintf(gid,"set xtics 0.2 \n");
       fprintf(gid,"set ytics 0.2 \n");
       fprintf(gid,"set ticslevel 0\n");
       fprintf(gid,"set contour\n");
       fprintf(gid,"set nokey\n");
       fprintf(gid,"set size square\n");

/* Relaxation 法による反復解法*/

    while(1) {
        gout++;
        cmax=0.0;
        for (i = 1; i < DIV-1; i++){
          for (j = 1; j < DIV-1; j++){
            corr = (u[i+1][j]+u[i-1][j]+u[i][j+1]+u[i][j-1])/4.0 - u[i][j];
         if ( fabs(corr) > cmax ) cmax = corr;
           u[i][j] = u[i][j]+corr;
           }
           }
         if ( cmax < EPS ) break;
           if (gout % INTERVAL != 0) continue;
              fprintf(gid,"splot '-' w lines"); /* 注目*/
              for (i = 0; i < DIV; i+=2){
              fprintf(gid,"\n");
              for (j = 0; j < DIV; j+=2){
             fprintf(gid,"%e %e %e\n",i*MESH,j*MESH,u[i][j]);
             }
            }
fprintf(gid,"e\n"); /* データ入力終了の印*/
}
/* 等高線の出力gnuplot にお任せ*/
           fprintf(gid,"set cntrparam levels incre 0,0.05,1\n");
           fprintf(gid,"set nosurface\n");
           fprintf(gid,"set view 0,0\n");
           fprintf(gid,"set noclabel\n");
           fprintf(gid,"splot '-' w lines lt 2\n");
            for (i = 0; i < DIV; i++){
             fprintf(gid,"\n");
              for (j = 0; j < DIV; j++){
               fprintf(gid,"%e %e %e\n",i*MESH,j*MESH,u[i][j]);
             }
            }
            fprintf(gid,"e\n");
            fprintf(gid,"pause 60\n");
            pclose(gid);
}
[出力結果]
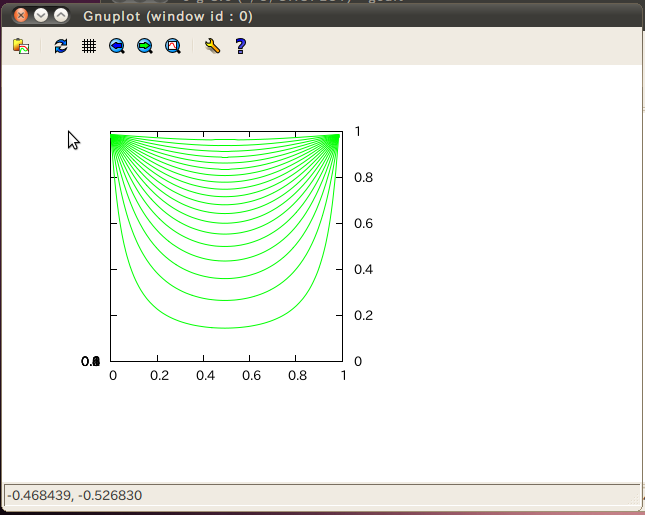
例9.
#include <stdio.h>
#include <stdlib.h>
#include <math.h>

int main(int argc, char **argv)
{
  FILE *gid;
  int i,j;
  double x;
     gid = popen("gnuplot -geometry 512x384","w");
       fprintf(gid, "set yrange[1:3]\n");
       fprintf(gid, "set y2range[0:1]\n");
       fprintf(gid, "set y2tics \n");
       fprintf(gid, "set x2tics \n");
       fprintf(gid, "set xtics nomirror\n");
       fprintf(gid, "set ytics nomirror\n");
         for (i=0; i<20; i++){
           fprintf(gid, "plot '-' t 'Bottom-Left' w lines, \
              '-' t 'Top-Right' axis x2y2\n");
         for (j=0; j<100; j++){ /* 1番目のデータ*/
           x = 0.02*j;
           fprintf(gid,"%e %e\n",x,1+i*0.1/(1+x*x));
           }
           fprintf(gid,"e\n"); /* データ入力終了*/
            for (j=0; j<100; j++){ /* 2番目のデータ*/
             x = 0.01*j;
             fprintf(gid,"%e %e\n", x, 1-exp(-(i*0.1)*x));
            }
          fprintf(gid,"e\n"); /* データ入力終了*/
          }
       fprintf(gid,"pause 60\n");
       pclose(gid);
}
[出力結果]
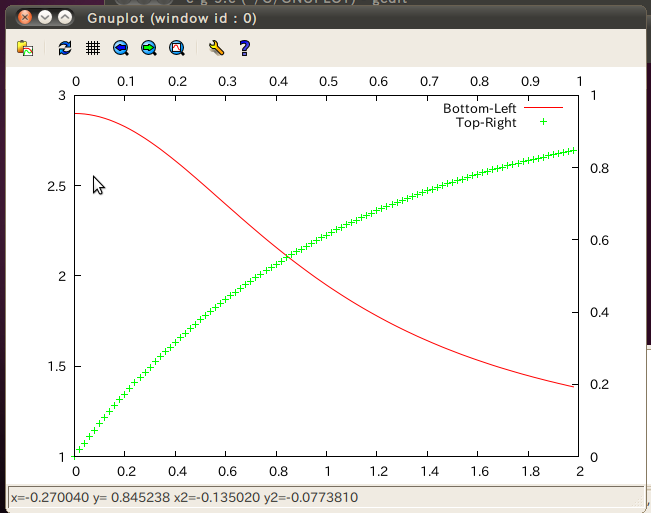
例10. マトリックスデータの表示 その1
#include <stdio.h>

#define N_XPIXELS 3
#define N_YPIXELS 3
#define SLEEP 10000000

void write_data();
FILE *gp;

/* data: 3 x 3 */
int IMG[] = {
		1,0,0,
		0,1,1,
		1,0,1,
};


int main (int argc, char *argv[] )
{
	int i,j,k;

	gp = popen("gnuplot -geometry 480x480","w");
	fprintf(gp, "set pm3d\n");
	fprintf(gp, "set view 0,0\n");
	fprintf(gp, "unset key\n");
	fprintf(gp, "splot '-' with pm3d\n");

	write_data();

	fprintf(gp,"e\n");
	fflush(gp);
	usleep(SLEEP);

	fclose(gp);
}


/* write data for gnuplot */
void write_data(){

	int i,x,y;

	for (x=0; x<N_XPIXELS; x++){
		for (y=0; y<N_YPIXELS; y++){
			i = x + (N_YPIXELS -y -1)*N_XPIXELS;
			fprintf(gp, "%d  %d %d\n", x, y,    IMG[i]);
			fprintf(gp, "%d  %d %d\n", x, y+1,  IMG[i]);
		}
		fprintf(gp, "\n");

		for (y=0; y<N_YPIXELS; y++){
			 i = x + (N_YPIXELS -y -1)*N_XPIXELS;
			 fprintf(gp, "%d  %d %d\n", x+1,   y, IMG[i]);
			 fprintf(gp, "%d  %d %d\n", x+1, y+1, IMG[i]);
		}
		fprintf(gp, "\n");
	}
}
[出力結果]
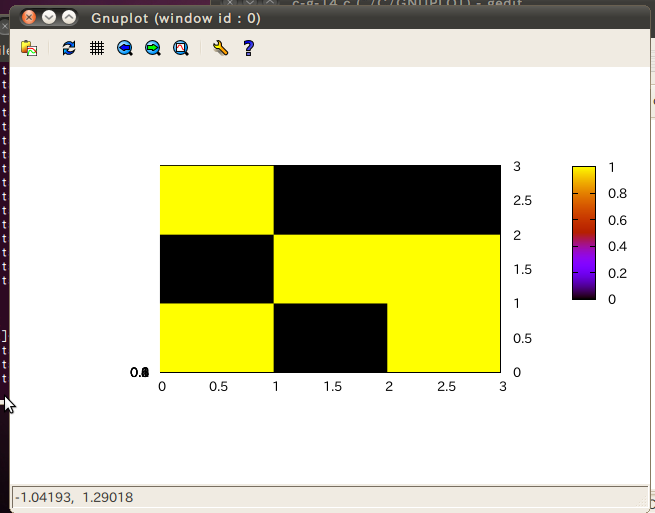
例10. マトリックスデータの表示 その2
#include <stdio.h>

#define N_XPIXELS 20
#define N_YPIXELS 20
#define SLEEP 10000000

void write_2d_data();

FILE *gp;

/* data: 20 x 20 */
int I[] = {
		0,0,0,0,1,1,0,0,1,0,0,0,0,0,0,0,0,0,1,0,
		1,1,1,1,1,1,1,1,1,1,0,1,1,1,1,1,1,1,1,1,
		0,0,0,0,1,1,0,0,0,0,0,0,0,0,1,1,0,0,0,0,
		0,1,1,0,1,1,0,1,1,0,0,0,0,0,1,1,0,0,0,0,
		0,1,0,0,1,1,0,1,0,0,0,1,1,0,1,1,0,1,1,0,
		1,0,1,0,1,1,0,1,1,0,0,1,1,0,1,1,1,1,1,1,
		1,0,0,1,1,1,1,0,0,1,0,1,1,0,1,1,0,1,1,0,
		0,0,0,0,1,1,0,0,0,0,0,1,1,0,1,1,0,1,1,0,
		0,0,0,1,1,1,1,1,0,0,0,1,1,0,1,1,0,1,1,0,
		0,0,1,0,1,1,0,0,1,1,0,1,1,0,1,1,0,1,1,0,
		1,1,0,0,1,1,0,0,1,1,0,1,1,0,1,1,0,1,1,0,
		0,0,0,1,0,0,0,1,0,0,0,1,1,1,1,1,1,1,1,0,
		0,0,0,1,1,1,1,1,1,0,0,1,1,0,0,0,0,1,1,0,
		0,0,1,1,0,0,0,1,0,0,0,0,0,0,0,0,0,1,1,0,
		0,1,1,0,0,0,1,0,0,0,0,0,0,0,0,0,1,1,0,0,
		1,0,0,1,0,1,0,0,0,0,0,0,0,0,1,1,1,1,0,0,
		0,0,0,0,1,1,1,0,0,0,0,0,0,0,0,0,1,0,0,0,
		0,0,0,1,1,0,1,1,1,0,0,0,0,0,0,0,0,0,0,0,
		0,0,1,1,0,0,0,0,1,1,1,1,1,1,1,1,1,1,1,1,
		1,1,0,0,0,0,0,0,0,0,1,1,1,1,1,1,1,1,1,0
};


int main (int argc, char *argv[] )
{
	int i,j,k;

	gp = popen("gnuplot -geometry 480x480","w");
//	fprintf(gp, "set term x11\n");
	fprintf(gp, "set yrange [] reverse\n");
	fprintf(gp, "unset key\n");

//	fprintf(gp, "set out 'filename%d-%d.eps'\n",k,i);

	fprintf(gp, "plot '-' matrix with image\n");

	write_2d_data();

	fprintf(gp,"e\n");
	fprintf(gp,"e\n");
	fflush(gp);
	usleep(SLEEP);

	fclose(gp);
}


/* write data for gnuplot */
void write_2d_data(){

	int n_pixels = N_XPIXELS*N_YPIXELS;
	int i;

	for (i=0; i<n_pixels; i++){
		fprintf(gp, "%d ", I[i]);
		if (  (i+1)%N_XPIXELS  ==  0 ){
			fprintf(gp, "\n");
		}
	}
}
[出力結果]
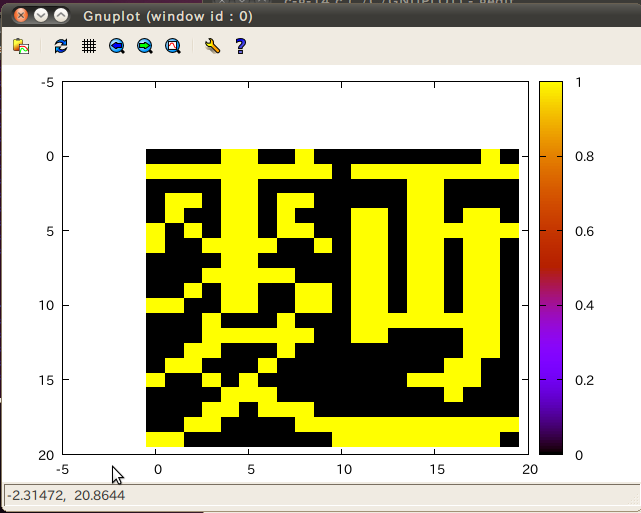
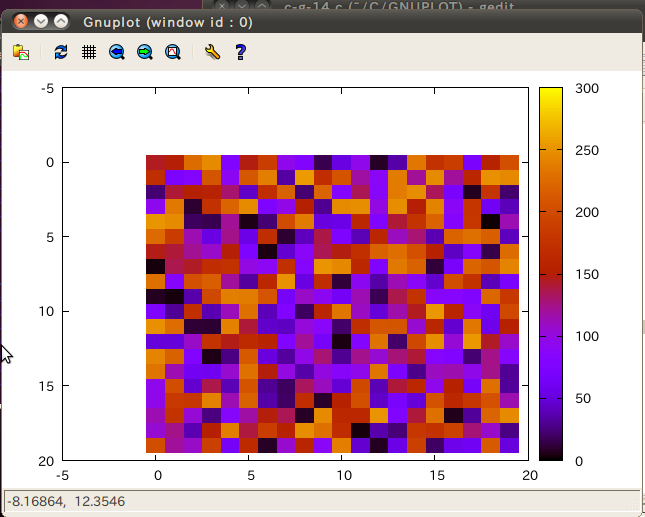
例10. マトリックスデータの表示 その3
#include <stdlib.h>  /*  drand48() */
#include <stdio.h>

#define N_XPIXELS 20
#define N_YPIXELS 20
#define RAND_SEED 20090503
#define SLEEP 100000000

void write_2d_data(unsigned char *img);
unsigned char *alloc_1d_uchar(int n);

FILE *gp;

int main (int argc, char *argv[] )
{
	int i, n;
	int nx, ny;
	unsigned char *img;
	long seed = RAND_SEED;

	srand48(seed);

	nx = N_XPIXELS;
	ny = N_YPIXELS;
	n = nx*ny;
	img = alloc_1d_uchar(n);

	for (i=0; i < n; i++){
		img[i] = (unsigned char)(255.0*drand48());
	}

	gp = popen("gnuplot -geometry 480x480","w");

//	gp = popen("gnuplot","w");
//	fprintf(gp, "set terminal postscript eps color \"Times\" 20\n");
//	fprintf(gp, "set terminal tgif\n");
//      fprintf(gp, "set term x11\n");

	fprintf(gp, "set yrange [] reverse\n");
	fprintf(gp, "unset key\n");

//  fprintf(gp, "set out 'image000.eps'\n");
//  fprintf(gp, "set out 'image000.obj'\n");

	fprintf(gp, "plot '-' matrix with image\n");

	write_2d_data(img);
	fprintf(gp,"e\n");
	fprintf(gp,"e\n");
	fflush(gp);

	usleep(SLEEP); /* comment out when generate a file */

	fclose(gp);
	free(img);

}

/* write data for gnuplot */
void write_2d_data(unsigned char *img){

        int n_pixels = N_XPIXELS*N_YPIXELS;
        int i;

        for (i=0; i<n_pixels; i++){
                fprintf(gp, "%d ", img[i]);
                if (  (i+1)%N_XPIXELS  ==  0 ){
                        fprintf(gp, "\n");
                }
        }
}


/*** Allocate 1d array of uchars ***/
unsigned char *alloc_1d_uchar(int n){

	unsigned char *new;
	new = (unsigned char *) malloc ((unsigned) (n * sizeof (char)));
	if (new == NULL) {
		printf("ALLOC_1D_CHAR: Couldn't allocate array of uchars\n");
		return (NULL);
	}
	return (new);

}
[出力結果]
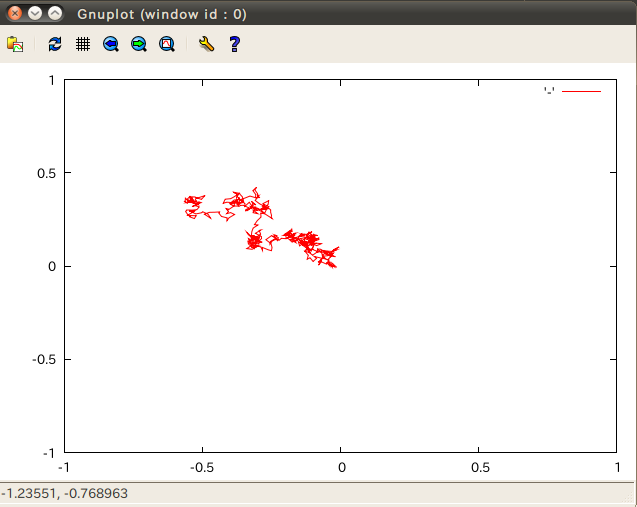
例11.2次元酔歩問題のシミュレーション
#include <stdio.h>
#include <stdlib.h>
#include <unistd.h>
#include <math.h>
#include <time.h>

#define L 512

main(int argc, char **argv)
{
  int i, interval=100;
  double x, y, S=sqrt(1.0/L);
  FILE *GP;

  if (argc == 2)  interval = atoi(argv[1]);

  srand48(time(NULL));
  GP = popen("gnuplot -geometry 384x384","w");
  fprintf(GP, "set xrange[-1:1]\n");
  fprintf(GP, "set yrange[-1:1]\n");
  fflush(GP);
  sleep(1);

  while(1){
    fprintf(GP, "plot '-' with lines lt 1\n");
    fflush(GP);
    sleep(1);
    x=0; y=0;
    for (i = 0; i < L; i++){
      fprintf( GP, "%f %f\n",
              x += S*(drand48()-0.5),  y += S*(drand48()-0.5) );
    }
    fprintf(GP,"e\n");
    fflush(GP);
    sleep(1);
  }
  fclose(GP);
}
[出力結果]
Back to C Language