
次のように作り、 Gnuplotで表示させる。 ちなみに、ここでファイルを分割するには、次を使うと便利。
split -51 pattern.txt sh_
のコマンドでOK.
50行×50行の行列の後、一つの空白のため、 51行ごとに分割。
#include <stdio.h>
#include <stdlib.h>
#include <time.h>
#define LAT 50

/*for function*/
 double ransuu01();
 int bc();

main(){
 int s[LAT][LAT];
 int i,j,k,h,t,nt;
 int focal,nei,nei_r, nei_b,nei_e;
 int count_e,choose;
 int judge;
 double happy[LAT][LAT];
 double no_neighbor;
 double initial_r, initial_b; /*initial densities of red and blue*/
 double ini_ran;
 double threshold_r, threshold_b;
 srand(time(0));// seed for random number

 FILE *fpc,*fpd;
 fpc=fopen("pattern.txt","w");
 fpd=fopen("happyness.txt","w");

 no_neighbor = 8.0;//Moore neighborhood
 initial_r = 0.3;
 initial_b = 0.5;
 threshold_r = 0.3;
 threshold_b = 0.5;

/*initial distribution of red and blue*/
 for(i=0;i<LAT;i++){
   for(j=0;j<LAT;j++){
      ini_ran = ransuu01();
      s[i][j]=0;
      if( ini_ran < initial_r) s[i][j]=1;
   else if( ini_ran < initial_r + initial_b) s[i][j]=2;
 }
}

for(nt=0;nt<100;nt++){

for(t=0;t<10;t++){
/* choose one site occupied by a red or a blue from the whole lattice sites */
   focal = 0;
   while(focal == 0){
   i= (int)((double)LAT*ransuu01()) ;
   j= (int)((double)LAT*ransuu01()) ;
   focal = s[i][j];
 }

/*calculate the happyness of a player in (i, j)*/
  nei_r = 0;
  nei_b = 0;
  nei_e = 0;
    for(k=-1;k<=1;k++){
      for(h=-1;h<=1;h++){
        if(k*k + h*h > 0 ){
          nei=s[bc(i+k)][bc(j+h)];
        if(nei == 1) nei_r = nei_r + 1;
        else if(nei == 2) nei_b = nei_b + 1;
       nei_e = (int)no_neighbor - nei_r - nei_b;
     }
    }
   }

/*move if the player does not feel happy */
 if(nei_e > 0){// empty sites exits in the neighbor sites.
   if(focal == 1){ //red
     if((double)nei_r/no_neighbor < threshold_r){
//以下は、空白隣接点のうち、一つをランダムに選んで、そこへ移動するという作業
    count_e=0;
    choose = rand()%nei_e + 1;
    judge=0;
  for(k=-1;k<=1;k++){
    for(h=-1;h<=1;h++){
      if( k*k + h*h > 0 && judge==0){
      if( s[bc(i+k)][bc(j+h)] == 0 ) count_e=count_e + 1;
      if(count_e == choose){
        s[bc(i+k)][bc(j+h)]=focal;
        s[i][j]=0;
        judge=1;
        }
      }
     }
    }
  }
 }
 else if(focal == 2){
  if( (double)nei_b/no_neighbor < threshold_b){
     count_e=0;
     choose = rand()%nei_e + 1;
     judge=0;
  for(k=-1;k<=1;k++){
     for(h=-1;h<=1;h++){
   if( k*k + h*h > 0 && judge==0){
   if( s[bc(i+k)][bc(j+h)]== 0 ) count_e=count_e + 1;
   if(count_e == choose){
         s[bc(i+k)][bc(j+h)]=focal;
         s[i][j]=0;
         judge=1;
         }
        }// if( k*k + h*h > 0)
       }// for h
     }// for k
    }//if(nei_b < threshold_b)
  }// else if(focal == 2) blue
}//if(nei_e > 0)

/*lattice pattern*/
  if(t == 2){
    for(i=0;i<LAT;i++){
     for(j=0;j<LAT;j++)
       fprintf(fpc,"%d ",s[i][j]);
       fprintf(fpc,"\n");
     }// for i
    fprintf(fpc,"\n");
    }//if(t)

/*happyness*/
  if(t == 2){
     for(i=0;i<LAT;i++){ for(j=0;j<LAT;j++){
       happy[i][j]=0.0;
       focal = s[i][j];
       nei_r = 0; nei_b = 0; nei_e = 0;
         for(k=-1;k<=1;k++){
           for(h=-1;h<=1;h++){
             if(k*k + h*h > 0 ){ // except both k=0 and h=0
              nei=s[bc(i+k)][bc(j+h)];
             if(nei == 1) nei_r = nei_r + 1;
             else if(nei == 2) nei_b = nei_b + 1;
              nei_e = 8 - nei_r - nei_b;
             }//if(k*k + h*h > 0 )
           }// for h
          }// for k
       if(focal == 1) happy[i][j]=(double)nei_r/no_neighbor;
       else if(focal == 2) happy[i][j]=(double)nei_b/no_neighbor;
         }//for(j=0;j<LAT;j++)
       }//for(i=0;i<LAT;i++)
       for(i=0;i<LAT;i++){
         for(j=0;j<LAT;j++) fprintf(fpd,"%f ",happy[i][j]);
           fprintf(fpd,"\n");
          }// for i
         fprintf(fpd,"\n");
        }//if(t== 100)
        fprintf(fpd,"\n");
        //printf("\n\n");
       } //for t
} //for nt

      fclose(fpd);
      fclose(fpc);
   return 0;
}

double ransuu01()
{
 return (double)rand()/((double)RAND_MAX+1.0);
}

int bc(i)
int i;
{
 if(0<=i && i<LAT) return i;
 if(i<0) return i+LAT;
 else if(i>=LAT) return i-LAT;
}
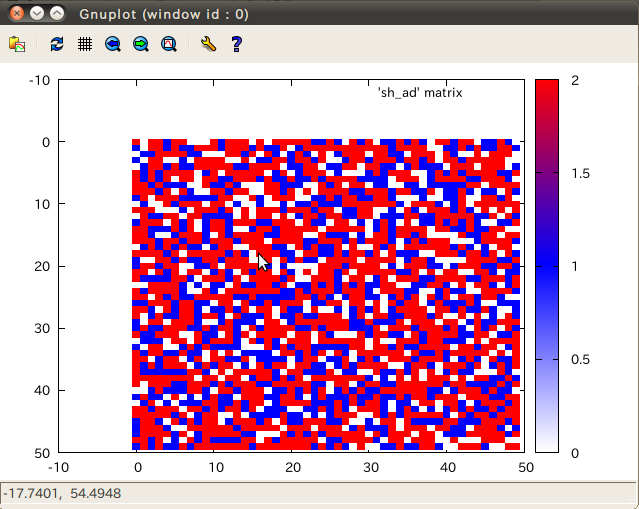
Gnuplotで表示させるためのファイルとして次のように書けば、ちゃんと表示される。
set yrange [] reverse
set palette defined (0 "white",1 "blue", 2 "red")
plot 'sh_aa' matrix with image
pause 1
plot 'sh_ab' matrix with image
pause 1
plot 'sh_ac' matrix with image
pause 1
plot 'sh_ad' matrix with image
pause 1

略
[出力結果]
Back to C Language