


【解説】【MQL5 community】 : Dual Trix 15 and 30 (2つの移動平均を表示させたもの) を改良し、数値が表示されるようにしたもの。
【シグナル】
2つの移動平均 を使用するシグナルとして、
一般に中期の移動平均線が上昇し、長期の移動平均線を 下から上に突き抜ける形で交差すると、 低迷していた価格が上昇しはじめたことを示すと言われている。 これが「ゴールデンクロス(Golden Cross)」。 その逆の中期の移動平均線が下降し、長期の移動平均線を 上から下に突き抜ける形で交差すると、 価格が下降しはじめたことを示すと言われている。 これが「デットクロス(Dead Cross)」。
//+------------------------------------------------------------------+
//| Trix_Upgrade_1.mq5 |
//| Copyright 2010, Q_IMPORT |
//| mql.shell@gmail.com |
//+------------------------------------------------------------------+
#property copyright "Q_IMPORT"
#property link "mql.shell@gmail.com"
#property version "3.1"
#property indicator_separate_window
#property indicator_buffers 4
#property indicator_plots 2
//--- plot First Plot
#property indicator_label1 "Plot1" //Type Of Line To Draw On First Plot
#property indicator_type1 DRAW_LINE
#property indicator_color1 Red
#property indicator_style1 STYLE_SOLID
#property indicator_width1 1
//--- plot Second Plot
#property indicator_label2 "Plot2" //Type Of Line To Draw On Second Plot
#property indicator_type2 DRAW_LINE
#property indicator_color2 Blue
#property indicator_style2 STYLE_SOLID
#property indicator_width2 1
//--- plot Third Plot
//--- plot Fourth Plot
//+------------------------------------------------------------------+
//--- input parameters
input bool State1=true;
input int Plot1=15; //Period Of The First Plot
input int Plot2=30; //Period Of The Second Plot
input ENUM_APPLIED_PRICE ToClose=PRICE_CLOSE; //Price Applied To Both Plots
//+------------------------------------------------------------------+
//--- indicator buffers
double TriX1[], // Dynamic array to hold the values of Trix
EXT_TriX1[],
TriX2[], // Dynamic array to hold the values of Trix
EXT_TriX2[],
TriX3[], // Dynamic array to hold the values of Trix Calculations
EXT_TriX3[],
TriX4[], // Dynamic array to hold the values of Trix Calculations
EXT_TriX4[];
int TriXHandle1, // Buffer to hold Trix 3 Array Access
TriXHandle2; // Buffer to hold Trix 4 Array Access
//+------------------------------------------------------------------+
int window1;
int window;
string objectName="Guage1";
string objectName1="Guage2";
//+------------------------------------------------------------------+
//+------------------------------------------------------------------+
//| Custom indicator initialization function |
//+------------------------------------------------------------------+
int OnInit()
{
//--- indicator buffers mapping
SetIndexBuffer(0,TriX1,INDICATOR_DATA);
SetIndexBuffer(1,TriX2,INDICATOR_DATA);
SetIndexBuffer(2,TriX3,INDICATOR_CALCULATIONS);
SetIndexBuffer(3,TriX4,INDICATOR_CALCULATIONS);
ArraySetAsSeries(TriX1,true); // index Trix1 array as a time series
ArraySetAsSeries(TriX2,true); // index Trix1 array as a time series
ArraySetAsSeries(TriX3,true); // index Trix1 array as a time series
ArraySetAsSeries(TriX4,true); // index Trix1 array as a time series
ArrayInitialize(TriX3,EMPTY_VALUE); // Create Calculation Array As Value Zero
ArrayInitialize(TriX4,EMPTY_VALUE); // Create Calculation Array As Value Zero
//+------------------------------------------------------------------+
TriXHandle1=iTriX(Symbol(),0,Plot1,ToClose);
TriXHandle2=iTriX(Symbol(),0,Plot2,ToClose);
//+------------------------------------------------------------------+
// PlotIndexSetInteger(0,PLOT_DRAW_BEGIN,Plot1+Plot2);
IndicatorSetInteger(INDICATOR_DIGITS,6);
window=ChartWindowFind();
window1=ChartWindowFind();
//---
return(0);
}
//+------------------------------------------------------------------+
//| Custom indicator iteration function |
//+------------------------------------------------------------------+
int OnCalculate (const int rates_total, // size of the price[] array;
const int prev_calculated,// number of available bars ;
// at the previous call;
const int begin, // what index in the array
// price[] the reliable information starts from;
const double &price[]) // array the indicator will be calculated by;
{
//--- we can copy not all data
int i = 0;
int to_copy;
if(prev_calculated>rates_total || prev_calculated<=0) to_copy=rates_total;
else
{
to_copy=rates_total-prev_calculated;
//--- last value is always copied
to_copy++;
}
(CopyBuffer(TriXHandle1,0,0,to_copy,TriX1));
(CopyBuffer(TriXHandle2,0,0,to_copy,TriX2));
(CopyBuffer(TriXHandle1,0,0,to_copy,TriX3));
(CopyBuffer(TriXHandle2,0,0,to_copy,TriX4));
//------------------------------------------------------------+
// Trix Gauge 1 +
//------------------------------------------------------------+
ObjectCreate(0,objectName,OBJ_TEXT,window,0,0);
ObjectSetString(0,objectName,OBJPROP_TEXT,DoubleToString(TriX1[to_copy-1],6));
ObjectSetInteger(0,objectName,OBJPROP_COLOR,Red);
datetime tm[1];
CopyTime(_Symbol,_Period,0,1,tm);
ObjectSetInteger(0,objectName,OBJPROP_TIME,tm[0]);
ObjectSetDouble(0,objectName,OBJPROP_PRICE,(TriX1[to_copy-1]));
//------------------------------------------------------------+
// Trix Gauge 2 +
//------------------------------------------------------------+
ObjectCreate(0,objectName1,OBJ_TEXT,window1,0,0);
ObjectSetString(0,objectName1,OBJPROP_TEXT,DoubleToString(TriX2[to_copy-1],6));
ObjectSetInteger(0,objectName1,OBJPROP_COLOR,Blue);
datetime tm1[1];
CopyTime(_Symbol,_Period,0,1,tm1);
ObjectSetInteger(0,objectName1,OBJPROP_TIME,tm1[0]);
ObjectSetDouble(0,objectName1,OBJPROP_PRICE,(TriX2[to_copy-1]));
return(rates_total);
}
//+------------------------------------------------------------------+
【表示結果】
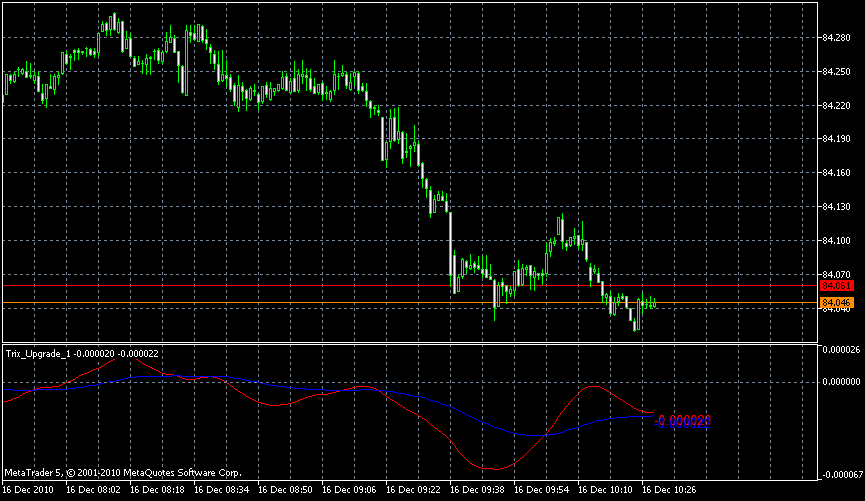
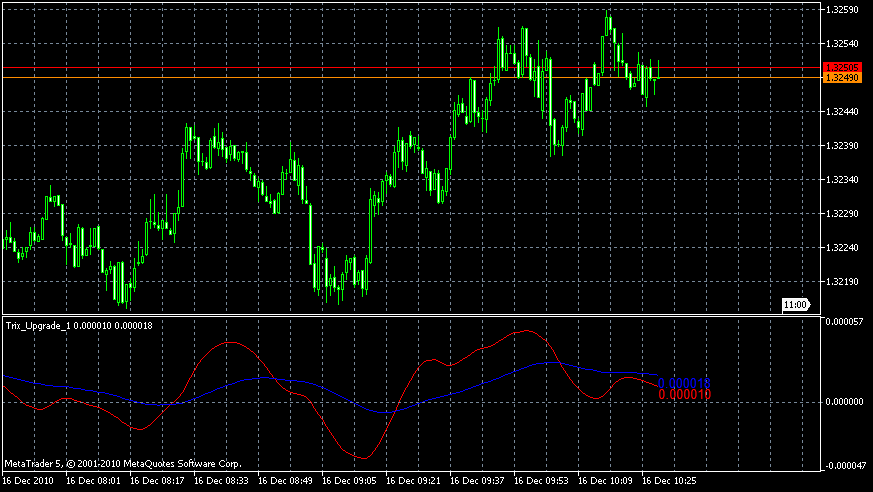
Back to Meta Trader