


【解説】【MQL5 community】 Fractal Adaptive Moving Average (フラクタル 適応型移動平均): 相場全体の大きな値動きの中の反転ポイントを示す。 この反転ポイントには、ブル(強気)フラクタルと、ベア(弱気)フラクタルがある。
【計算法】
FRAMA(i) = A(i) * Price(i) + (1 - A(i)) * FRAMA(i-1)
ただし A(i) : current factor of exponential smoothing.
またExponential smoothing factorは次のように計算される.
A(i) = EXP(-4.6 * (D(i) - 1))
ただしD(i) : i期のフラクタル次元。
フラクタル次元は長期的なシグナルの次元を測定する指数です。 自己相似的な数値の「複雑さ」を測定します。 特にフラクタル次元は、シグナルが直線的になるほど1.0に近付く傾向があるほか、 ボラティリティに合わせて増加します。 株価の実際の値動きに先立って相場の調整を読み取る機能があります。
フラクタル次元とは次のように計算される.
D = (LOG(N1 + N2) - LOG(N3))/LOG(2.0)
また N(Length,i) = (期間内の最大値 - 期間内の最小値)/期間とし,
N1(i) = N(Length,i) : 現在のポイントとn期前のポイントとのすべての距離を合計した数値.
N2(i) = N(Length,i + Length) : (現在のポイントとn期前のポイントとの直線距離)
N3(i) = N(2 * Length,i)
である.
【シグナル】
直近Up Fractalを更新したら買い, 逆にDown Fractalを更新したら売り.
また繰り返し安値を更新したり、高値を更新すれば、トレンドが発生していると見ることができる。
//+------------------------------------------------------------------+
//| FrAMA.mq5 |
//| Copyright 2010, MetaQuotes Software Corp. |
//| http://www.mql5.com |
//+------------------------------------------------------------------+
#property copyright "2010, MetaQuotes Software Corp."
#property link "http://www.mql5.com"
#property description "Fractal Adaptive Moving Average"
//--- indicator settings
#property indicator_chart_window
#property indicator_buffers 1
#property indicator_plots 1
#property indicator_type1 DRAW_LINE
#property indicator_color1 DarkBlue
#property indicator_width1 1
#property indicator_label1 "FrAMA"
#property indicator_applied_price PRICE_CLOSE
//--- input parameters
input int InpPeriodFrAMA=14; // FrAMA period
input int InpShift=0; // Indicator's shift
//--- indicator buffers
double FrAmaBuffer[];
double High[];
double Low[];
//+------------------------------------------------------------------+
//| Custom indicator initialization function |
//+------------------------------------------------------------------+
void OnInit()
{
//--- indicator buffers mapping
SetIndexBuffer(0,FrAmaBuffer,INDICATOR_DATA);
SetIndexBuffer(1,High,INDICATOR_CALCULATIONS);
SetIndexBuffer(2,Low,INDICATOR_CALCULATIONS);
//--- sets first bar from what index will be drawn
PlotIndexSetInteger(0,PLOT_DRAW_BEGIN,2*InpPeriodFrAMA-1);
//--- sets indicator shift
PlotIndexSetInteger(0,PLOT_SHIFT,InpShift);
//--- name for indicator label
IndicatorSetString(INDICATOR_SHORTNAME,"FrAMA("+string(InpPeriodFrAMA)+")");
//--- name for index label
PlotIndexSetString(0,PLOT_LABEL,"FrAMA("+string(InpPeriodFrAMA)+")");
//--- initialization done
}
//+------------------------------------------------------------------+
//| Fractal Adaptive Moving Average |
//+------------------------------------------------------------------+
int OnCalculate(const int rates_total,
const int prev_calculated,
const int begin,
const double &price[])
{
//--- check for data
if(rates_total<2*InpPeriodFrAMA)
return(0);
//--- preparing calculation
int limit,copied;
double Hi1,Hi2,Hi3,Lo1,Lo2,Lo3;
double N1,N2,N3,D;
double ALFA;
//--- load High
copied=CopyHigh(_Symbol,_Period,0,rates_total,High);
if(copied!=rates_total)
{
Print("Can't load High prices.");
return(0);
}
//--- load Low
copied=CopyLow(_Symbol,_Period,0,rates_total,Low);
if(copied!=rates_total)
{
Print("Can't load Low prices.");
return(0);
}
//--- start calculations
if(prev_calculated==0)
{
limit=2*InpPeriodFrAMA-1;
//--- fill in indicator array
for(int i=0;i<=limit;i++)
FrAmaBuffer[i]=price[i];
}
else limit=prev_calculated-1;
//--- main cycle
for(int i=limit;i<rates_total;i++)
{
Hi1=iHighest(i,InpPeriodFrAMA);
Lo1=iLowest(i,InpPeriodFrAMA);
Hi2=iHighest(i-InpPeriodFrAMA,InpPeriodFrAMA);
Lo2=iLowest(i-InpPeriodFrAMA,InpPeriodFrAMA);
Hi3=iHighest(i,2*InpPeriodFrAMA);
Lo3=iLowest(i,2*InpPeriodFrAMA);
N1=(Hi1-Lo1)/InpPeriodFrAMA;
N2=(Hi2-Lo2)/InpPeriodFrAMA;
N3=(Hi3-Lo3)/(2*InpPeriodFrAMA);
D=(log(N1+N2)-log(N3))/log(2.0);
ALFA=exp(-4.6*(D-1.0));
FrAmaBuffer[i]=ALFA*price[i]+(1-ALFA)*FrAmaBuffer[i-1];
}
return(rates_total);
}
//+------------------------------------------------------------------+
//| Find the highest value in data range |
//+------------------------------------------------------------------+
double iHighest(int StartPos,
int Depth)
{
double res;
//--- check for parameters StartPos and Depth
if(StartPos<0 || StartPos-Depth+1<0 || Depth<0)
{
Print("Invalid parameter in function",__FUNCTION__,": StartPos =",StartPos,", Depth = ",Depth);
return(0.0);
}
//---
res=High[StartPos];
for(int i=StartPos-Depth+1;i<StartPos;i++)
if(High[i]>res)
res=High[i];
return(res);
}
//+------------------------------------------------------------------+
//| Find the lowest value in data range |
//+------------------------------------------------------------------+
double iLowest(int StartPos,
int Depth)
{
double res;
//--- check for parameters StartPos and Depth
if(StartPos<0 || StartPos-Depth+1<0 || Depth<0)
{
Print("Invalid parameter in function",__FUNCTION__,": StartPos =",StartPos,", Depth = ",Depth);
return(0.0);
}
//---
res=Low[StartPos];
for(int i=StartPos-Depth+1;i<StartPos;i++)
if(Low[i]<res)
res=Low[i];
return(res);
}
//+------------------------------------------------------------------+
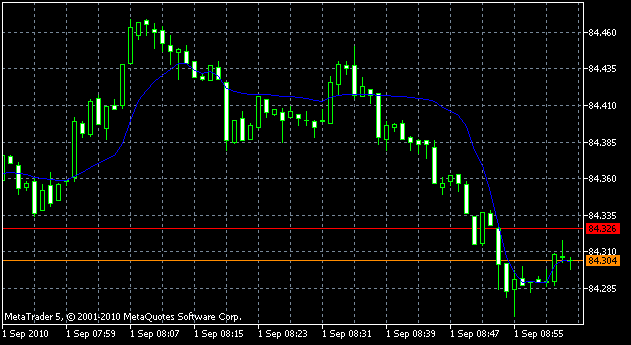
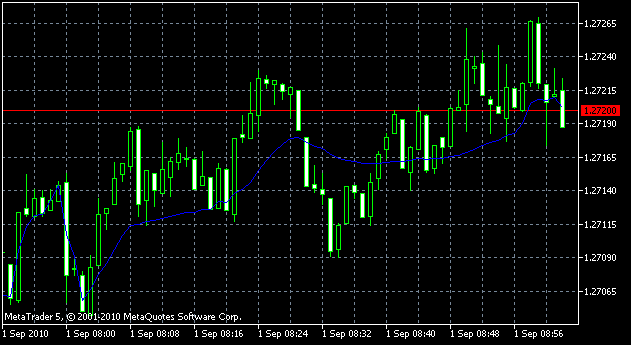
【表示結果】
Back to Meta Trader