


【解説】 【MQL5 community】 Ichimoku (一目均衡表): 相場は買い方と売り方の均衡が破れた方に動くという考え方に基づき、 相場の本質的動因を値幅(株価)よりむしろ時間(日柄)にあるとするチャート。
特に一目均衡表では、ローソク足のほかに、「基準線」、「転換線」、「遅行線」、「先行スパンA」、「先行スパンB」という5本の補助線をから構成される。
基準線
「過去26日間の高値と安値の平均値」で示される線であり、 相場の中期的な均衡点であると同時に、潜在的なトレンドを決定する線であり、 相場そのものの「基準」となる線である。 特に基準線の上昇を伴わない価格の上昇には、限界があるとされ、 逆に価格が基準線を上回った状態で基準線が上向いてきた時、 相場の基調は非常に強いと言えます。
転換線
「過去9日間の高値と安値の平均値」で示される線であり、 売り買いの圧力の短期的な均衡点を表す この転換線は「基準線」と同様に下値抵抗ラインの目処として使うことができます。 上昇トレンドが強くなっているときには値が下げた場合にも「基準線」までは下落せずに「転換線」まで下落して反転することが多くなると言われます。
遅行線
本日の終値を26日前にさかのぼって記入する。 つまり終値チャートを26日分左へ平行移動した線。 特に遅行線は「売り」か「買い」かのタイミングを計る場合に見ます。
先行スパンA(中期的な株価の趨勢)
転換線と基準線の平均値を26日先に記入する
先行スパンB(長期的な株価の趨勢)
過去52日間の高値と安値の平均値を26日先に記入する
抵抗帯(雲)
雲は先行スパンAと先行スパンBに挟まれたゾーンのことを言います。 雲の上でローソク足が推移している場合は相場が強い(上昇)と判断し、 下に位置している場合は弱いと判断します。 抵抗帯の名のとおり、抵抗帯の厚みが抵抗力の強弱を示すとされ、 厚い場合は、過去の相場のしこりの影響が強く、 相場転換には日柄を要します。 薄い場合は、影響が少ないので抜けやすく、転換しやすくなります。 ただし雲の厚みは、たとえ厚くても出来高が少なかったり、薄くても出来高が多いこともあるので、実際は、価格帯の広い狭いのみを表しているとされています。
【計算法】
基準線
(26日間最高値+26日間最安値)÷2
その日を含め、過去26日間の最高値と最安値のみを取り出した単純平均で、 相場の大勢方向を示します。
転換線
(9日間最高値+9日間最安値)÷2
その日を含め過去9日間の最高値と最安値の単純平均です。
先行スパン1
基準線と転換線の中値を26日先行させて表示します。
先行スパン2
過去52日間の最高値と最安値を単純平均し、26日先行させたものです。
※先行スパンは2つで中勢・大勢の支持・抵抗帯を示します。 また先行スパンAと先行スパンBがクロスする箇所は「変化日」であり、 相場のターニング・ポイントとなりやすいと考えられている。
遅行線
その日の終値を26日遅行させます。
【シグナル】
第1シグナル
移動平均のシグナルと同様に、 転換線が基準線を下から上へ抜ける(ゴールデンクロス)、かつ上昇中であれば、「買い」、 その逆で、上から下へ抜ける(デッドクロス)、かつ下降中であれば、「売り」。
第2シグナル
基準線が上向けば買い。下向けば売り。
第3シグナル
価格が抵抗帯より上にあれば「買いトレンド」、抵抗帯より下にあれば「売りトレンド」。
第4シグナル
遅行線が現在の価格を抜いた場合を「買い」、逆に下回った場合を「売り」。
//+------------------------------------------------------------------+
//| Ichimoku.mq5 |
//| Copyright 2009, MetaQuotes Software Corp. |
//| http://www.mql5.com |
//+------------------------------------------------------------------+
#property copyright "2010, MetaQuotes Software Corp."
#property link "http://www.mql5.com"
#property description "Ichimoku Kinko Hyo"
//--- indicator settings
#property indicator_chart_window
#property indicator_buffers 5
#property indicator_plots 4
#property indicator_type1 DRAW_LINE
#property indicator_type2 DRAW_LINE
#property indicator_type3 DRAW_FILLING
#property indicator_type4 DRAW_LINE
#property indicator_color1 Red
#property indicator_color2 Blue
#property indicator_color3 SandyBrown,Thistle
#property indicator_color4 Lime
#property indicator_label1 "Tenkan-sen"
#property indicator_label2 "Kijun-sen"
#property indicator_label3 "Senkou Span A;Senkou Span B"
#property indicator_label4 "Chinkou Span"
//--- input parameters
input int InpTenkan=9; // Tenkan-sen
input int InpKijun=26; // Kijun-sen
input int InpSenkou=52; // Senkou Span B
//--- indicator buffers
double ExtTenkanBuffer[];
double ExtKijunBuffer[];
double ExtSpanABuffer[];
double ExtSpanBBuffer[];
double ExtChinkouBuffer[];
//+------------------------------------------------------------------+
//| Custom indicator initialization function |
//+------------------------------------------------------------------+
void OnInit()
{
//--- indicator buffers mapping
SetIndexBuffer(0,ExtTenkanBuffer,INDICATOR_DATA);
SetIndexBuffer(1,ExtKijunBuffer,INDICATOR_DATA);
SetIndexBuffer(2,ExtSpanABuffer,INDICATOR_DATA);
SetIndexBuffer(3,ExtSpanBBuffer,INDICATOR_DATA);
SetIndexBuffer(4,ExtChinkouBuffer,INDICATOR_DATA);
//---
IndicatorSetInteger(INDICATOR_DIGITS,_Digits+1);
//--- sets first bar from what index will be drawn
PlotIndexSetInteger(0,PLOT_DRAW_BEGIN,InpTenkan);
PlotIndexSetInteger(1,PLOT_DRAW_BEGIN,InpKijun);
PlotIndexSetInteger(2,PLOT_DRAW_BEGIN,InpSenkou-1);
//--- lines shifts when drawing
PlotIndexSetInteger(2,PLOT_SHIFT,InpKijun);
PlotIndexSetInteger(3,PLOT_SHIFT,-InpKijun);
//--- change labels for DataWindow
PlotIndexSetString(0,PLOT_LABEL,"Tenkan-sen("+string(InpTenkan)+")");
PlotIndexSetString(1,PLOT_LABEL,"Kijun-sen("+string(InpKijun)+")");
PlotIndexSetString(2,PLOT_LABEL,"Senkou Span A;Senkou Span B("+string(InpSenkou)+")");
//--- initialization done
}
//+------------------------------------------------------------------+
//| get highest value for range |
//+------------------------------------------------------------------+
double Highest(const double&array[],int range,int fromIndex)
{
double res=0;
//---
res=array[fromIndex];
for(int i=fromIndex;i>fromIndex-range && i>=0;i--)
{
if(res<array[i]) res=array[i];
}
//---
return(res);
}
//+------------------------------------------------------------------+
//| get lowest value for range |
//+------------------------------------------------------------------+
double Lowest(const double&array[],int range,int fromIndex)
{
double res=0;
//---
res=array[fromIndex];
for(int i=fromIndex;i>fromIndex-range && i>=0;i--)
{
if(res>array[i]) res=array[i];
}
//---
return(res);
}
//+------------------------------------------------------------------+
//| Ichimoku Kinko Hyo |
//+------------------------------------------------------------------+
int OnCalculate(const int rates_total,const int prev_calculated,
const datetime &Time[],
const double &Open[],
const double &High[],
const double &Low[],
const double &Close[],
const long &TickVolume[],
const long &Volume[],
const int &Spread[])
{
int limit;
//---
if(prev_calculated==0) limit=0;
else limit=prev_calculated-1;
//---
for(int i=limit;i<rates_total;i++)
{
ExtChinkouBuffer[i]=Close[i];
//--- tenkan sen
double high=Highest(High,InpTenkan,i);
double low=Lowest(Low,InpTenkan,i);
ExtTenkanBuffer[i]=(high+low)/2.0;
//--- kijun sen
high=Highest(High,InpKijun,i);
low=Lowest(Low,InpKijun,i);
ExtKijunBuffer[i]=(high+low)/2.0;
//--- senkou span a
ExtSpanABuffer[i]=(ExtTenkanBuffer[i]+ExtKijunBuffer[i])/2.0;
//--- senkou span b
high=Highest(High,InpSenkou,i);
low=Lowest(Low,InpSenkou,i);
ExtSpanBBuffer[i]=(high+low)/2.0;
}
//--- done
return(rates_total);
}
//+------------------------------------------------------------------+
【表示結果】
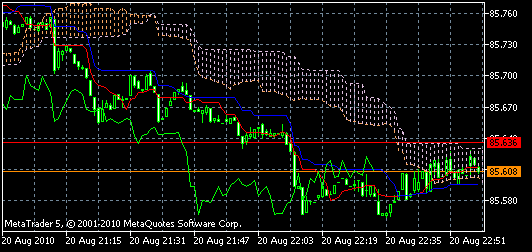
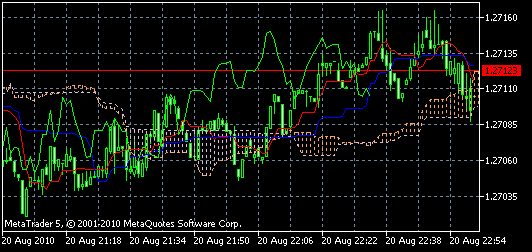
赤:転換線。青:基準線、緑:遅行線、UP雲:オレンジ、DOWN雲:紫。
移動平均におけるシグナルと相場のトレンドを示しており、妥当なシグナルを提供している。
Back to Meta Trader