


【解説】【MQL5 community】 Linear Regression Slope : 価格のダイナミクスを次の関数形で、回帰し、トレンドを掴み, これを用いて価格の変動を予想する.
y[x] = y0 + b*x
だだし x はステップ数 (x=1..n), y[x] は 価格 (open, close, median etc), b は回帰係数, y0 は切片とし, bは次で決定される.
b = (n*Sxy - Sx*Sy)/(n*Sxx - Sx*Sx)
ただし Sx = Sum(x, x = 1..n) = n*(n + 1)/2, Sy = Sum(y[x], x = 1..n), Sxx = Sum(x*x, x = 1..n) = n*(n+1)*(2*n+1)/6, Sxy = Sum(x*y[x], x = 1..n),
ただし n は回帰分析の期間を表す. またb の分母は次のように簡単化できる.
n*Sxx - Sx*Sx = n*n*(n-1)*(n+1)/12
これらからbは次のように変形することができる.
b = 6*(2*Sxy/(n + 1) - Sy)/n/(n - 1)
特にここでは次のSMA(simple moving average)とLWMA(linear weighted moving average)を用いる.
SMA = Sy/n
LWMA = 2*Sxy/n/(n + 1)
これらを使用すると, 線形回帰式は次のように得られる.
LRS_SMA = b/SMA = 6*(2*Sxy/Sy/(n + 1) - 1)/(n + 1)
LRS_LWMA = b/LWMA = 6*(1 - (n + 1)*Sy/Sxy/2)/(n + 1)
//+--------------------------------------------------------------------------------------+
//| Linear_Regression_Slope.mq5 |
//| Copyright gpwr. |
//+--------------------------------------------------------------------------------------+
#property copyright "gpwr"
#property version "1.00"
#property indicator_separate_window
#property indicator_buffers 1
#property indicator_plots 1
#property indicator_label1 "LRS"
#property indicator_type1 DRAW_LINE
#property indicator_color1 Blue
#property indicator_style1 STYLE_SOLID
#property indicator_width1 1
//===================================== INPUTS ===========================================
input int Per =40; // Linear regression period
input ENUM_APPLIED_PRICE Price =PRICE_MEDIAN; // Applied price
// Global variables
double x[];
// Indicator buffers
double lrs[];
// Custom indicator initialization function ---------------------------------------------+
void OnInit()
{
// Allocate memory for global arrays
ArrayResize(x,Per+1);
// Map indicator buffer
SetIndexBuffer(0,lrs);
IndicatorSetInteger(INDICATOR_DIGITS,5);
IndicatorSetString(INDICATOR_SHORTNAME,"LRS("+string(Per)+")");
PlotIndexSetInteger(0,PLOT_DRAW_BEGIN,Per+1);
}
//====================================== MAIN ============================================
int OnCalculate(const int rates_total,
const int prev_calculated,
const datetime& Time[],
const double& Open[],
const double& High[],
const double& Low[],
const double& Close[],
const long& tick_volume[],
const long& volume[],
const int& spread[])
{
// Check for insufficient data
if(rates_total<Per+1)
{
Print("Error: not enough bars in history!");
return(0);
}
// Main cycle ---------------------------------------------------------------------------+
int i=prev_calculated-1;
if(i<Per) i=Per;
while(i<rates_total)
{
for(int j=1;j<=Per;j++)
{
if(Price==PRICE_CLOSE) x[j]=Close[i-j];
if(Price==PRICE_OPEN) x[j]=Open[i-j];
if(Price==PRICE_HIGH) x[j]=High[i-j];
if(Price==PRICE_LOW) x[j]=Low[i-j];
if(Price==PRICE_MEDIAN) x[j]=(Low[i-j]+High[i-j])/2.;
if(Price==PRICE_TYPICAL) x[j]=(Low[i-j]+High[i-j]+Close[i-j])/3.;
if(Price==PRICE_WEIGHTED) x[j]=(Low[i-j]+High[i-j]+Close[i-j]+Open[i-j])/4.;
}
lrs[i]=LinRegrSlope(Per);
i++;
}
return(rates_total);
}
//==================================== FUNCTIONS =========================================
// Linear regression slope --------------------------------------------------------------+
double LinRegrSlope(int per)
{
double sum=0.0;
double wsum=0.0;
for(int i=per;i>0;i--)
{
sum+=x[i];
wsum+=x[i]*(per+1-i);
}
double lrs;
lrs=6.*(2.*wsum/(per+1)/sum-1.)/(per-1); // normalize to SMA
//lrs=6.*(1.0-(per+1)*sum/2./wsum)/(per-1); // normalize to LWMA
return(lrs*100000.); // convert to parts per 100k
}
【表示結果】
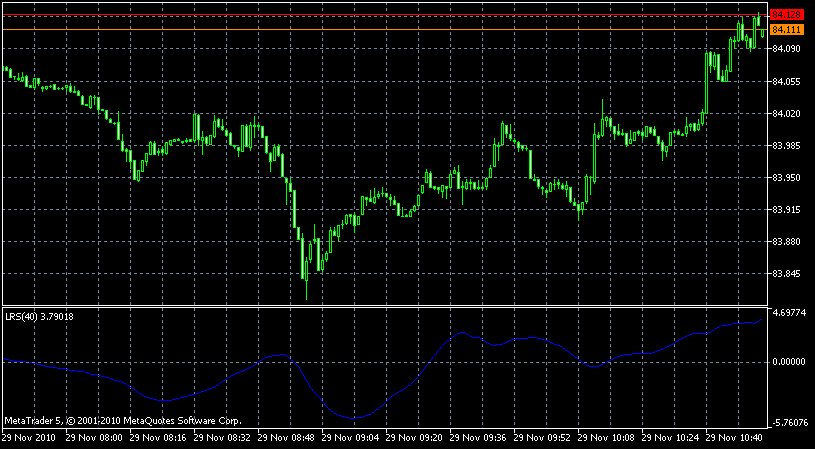
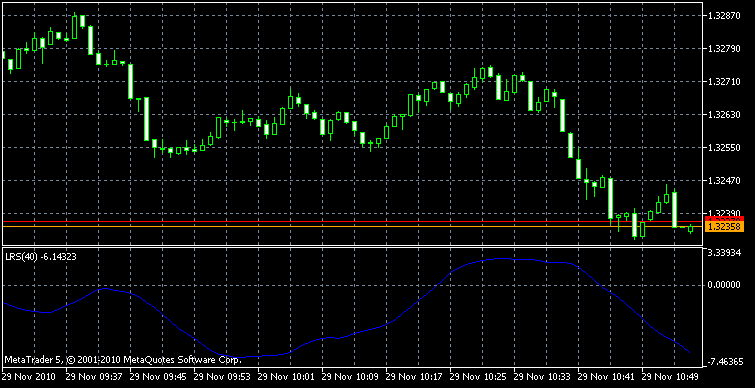
Back to Meta Trader