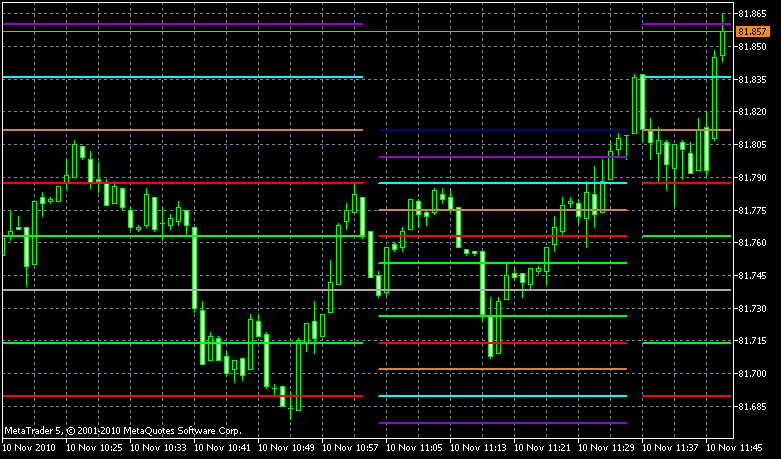
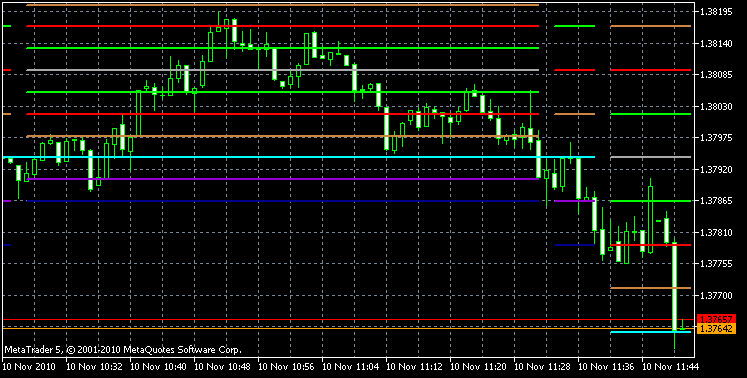
【解説】【MQL5 community】 Murrey_Math_MT5 : レジスタンスとサポートのラインを示したもの。
これはGyanサイクル(ギャン、伝説的なトレーダーが考察した理論) 「相場の値動きには自然科学の中にある振動の法則に支配されている。 よって価格の振動を厳密に調べることで、どのポイントで価格がサポートされ、どのポイントで抵抗を受けているかを確定できる」を受け、 価格が8段階あるとし、それぞれを示したもの。
■8/8と0/8:
Ultimate Resistanceと呼ばれ、 このラインを突き抜けることは最も難しく、サポートラインを示している。
■1/8, 7/8:
このラインは弱く、早いスピードでこの線のところに来たときは、 ここが抵抗線、サポートラインとなる。
■6/8と2/8:
4/8に次いで使用される線です。
■5/8と3/8:
5/8と3/8の間で価格変動は大抵この範囲内で動く。
■4/8:
この線が最も良く使用するサポート、レジスタンスラインです。
//+------------------------------------------------------------------+
//|                                              Murrey_Math_MT5.mq5 |
//|                                               Copyright VDV Soft |
//|                                                 vdv_2001@mail.ru |
//+------------------------------------------------------------------+
#property copyright "VDV Soft"
#property link      "vdv_2001@mail.ru"
#property version   "1.00"
#property description "The indicator is created on a basis and with algorithm use"
#property description "Vladislav Goshkov (VG) 4vg@mail.ru"
#property indicator_chart_window
#property indicator_buffers 13
#property indicator_plots   13
// ============================================================================================
//8/8 th's and 0/8 th's Lines (Ultimate Resistance)
//These lines are the hardest to penetrate on the way up, and give the greatest support
//on the way down. (Prices may never make it thru these lines).
// ============================================================================================
//7/8 th's Line (Weak, Stall and Reverse)
//This line is weak. If prices run up too far too fast, and if they stall at this line they will
//reverse down fast. If prices do not stall at this line they will move up to the 8/8 th's line.
// ============================================================================================
//6/8 th's and 2/8 th's Lines (Pivot, Reverse)
//These two lines are second only to the 4/8 th's line in their ability to force prices to reverse.
// This is true whether prices are moving up or down.
// ============================================================================================
//5/8 th's Line (Top of Trading Range)
//The prices of all entities will spend 40% of the time moving between the 5/8 th's
//and 3/8 th's lines. If prices move above the 5/8 th's line and stay above it for 10 to 12 days,
// the entity is said to be selling at a premium to what one wants to pay for it and prices
//will tend to stay above this line in the "premium area". If, however, prices fall
// below the 5/8 th's line then they will tend to fall further looking for support at a lower level.
// ============================================================================================
//4/8 th's Line (Major Support/Resistance)
//This line provides the greatest amount of support and resistance. This line has the greatest support
// when prices are above it and the greatest resistance when prices are below it. This price level is
//the best level to sell and buy against.
// ============================================================================================
//3/8 th's Line (Bottom of Trading Range)
//If prices are below this line and moving upwards, this line is difficult to penetrate.
//If prices penetrate above this line and stay above this line for 10 to 12 days then prices will stay
//above this line and spend 40% of the time moving between this line and the 5/8 th's line.
// ============================================================================================
//1/8 th Line (Weak, Stall and Reverse)
//This line is weak. If prices run down too far too fast, and if they stall at this line they will
//reverse up fast. If prices do not stall at this line they will move down to the 0/8 th's line.
// ============================================================================================
#define     width_line        2
//--- plot buffer 1
#property indicator_label1  "Extremely overshoot [-2/8]"
#property indicator_type1   DRAW_LINE
#property indicator_color1  DarkBlue
#property indicator_style1  STYLE_SOLID
#property indicator_width1  width_line
//--- plot buffer 2
#property indicator_label2  "Overshoot [-1/8]"
#property indicator_type2   DRAW_LINE
#property indicator_color2  DarkViolet
#property indicator_style2  STYLE_SOLID
#property indicator_width2  width_line
//--- plot buffer 3
#property indicator_label3  "Ultimate Support - extremely oversold [0/8]"
#property indicator_type3   DRAW_LINE
#property indicator_color3  Aqua
#property indicator_style3  STYLE_SOLID
#property indicator_width3  width_line
//--- plot buffer 4
#property indicator_label4  "Weak, Stall and Reverse - [1/8]"
#property indicator_type4   DRAW_LINE
#property indicator_color4  Peru
#property indicator_style4  STYLE_SOLID
#property indicator_width4  width_line
//--- plot buffer 5
#property indicator_label5  "Pivot, Reverse - major [2/8]"
#property indicator_type5   DRAW_LINE
#property indicator_color5  Red
#property indicator_style5  STYLE_SOLID
#property indicator_width5  width_line
//--- plot buffer 6
#property indicator_label6  "Bottom of Trading Range - [3/8], if 10-12 bars then 40% Time. BUY Premium Zone"
#property indicator_type6   DRAW_LINE
#property indicator_color6  Lime
#property indicator_style6  STYLE_SOLID
#property indicator_width6  width_line
//--- plot buffer 7
#property indicator_label7  "Major Support/Resistance Pivotal Point [4/8]- Best New BUY or SELL level"
#property indicator_type7   DRAW_LINE
#property indicator_color7  DarkGray
#property indicator_style7  STYLE_SOLID
#property indicator_width7  width_line
//--- plot buffer 8
#property indicator_label8  "Top of Trading Range - [5/8], if 10-12 bars then 40% Time. SELL Premium Zone"
#property indicator_type8   DRAW_LINE
#property indicator_color8  Lime
#property indicator_style8  STYLE_SOLID
#property indicator_width8  width_line
//--- plot buffer 9
#property indicator_label9  "Pivot, Reverse - major [6/8]"
#property indicator_type9   DRAW_LINE
#property indicator_color9  Red
#property indicator_style9  STYLE_SOLID
#property indicator_width9  width_line
//--- plot buffer 10
#property indicator_label10  "Weak, Stall and Reverse - [7/8]"
#property indicator_type10   DRAW_LINE
#property indicator_color10  Peru
#property indicator_style10  STYLE_SOLID
#property indicator_width10  width_line
//--- plot buffer 11
#property indicator_label11  "Ultimate Resistance - extremely overbought [8/8]"
#property indicator_type11   DRAW_LINE
#property indicator_color11  Aqua
#property indicator_style11  STYLE_SOLID
#property indicator_width11  width_line
//--- plot buffer 12
#property indicator_label12  "Overshoot [+1/8]"
#property indicator_type12   DRAW_LINE
#property indicator_color12  DarkViolet
#property indicator_style12  STYLE_SOLID
#property indicator_width12  width_line
//--- plot buffer 13
#property indicator_label13  "Extremely overshoot [+2/8]"
#property indicator_type13   DRAW_LINE
#property indicator_color13  DarkBlue
#property indicator_style13  STYLE_SOLID
#property indicator_width13  width_line


input int CalculationPeriod=64; // The calculation period P
input int StepBack=0;
//--- indicator buffers
double         Buffer1[];
double         Buffer2[];
double         Buffer3[];
double         Buffer4[];
double         Buffer5[];
double         Buffer6[];
double         Buffer7[];
double         Buffer8[];
double         Buffer9[];
double         Buffer10[];
double         Buffer11[];
double         Buffer12[];
double         Buffer13[];
int            ShiftBarsForward=100;
//+------------------------------------------------------------------+
//| Custom indicator initialization function                         |
//+------------------------------------------------------------------+
int OnInit()
  {

//--- indicator buffers mapping
   SetIndexBuffer(0,Buffer1,INDICATOR_DATA);
   SetIndexBuffer(1,Buffer2,INDICATOR_DATA);
   SetIndexBuffer(2,Buffer3,INDICATOR_DATA);
   SetIndexBuffer(3,Buffer4,INDICATOR_DATA);
   SetIndexBuffer(4,Buffer5,INDICATOR_DATA);
   SetIndexBuffer(5,Buffer6,INDICATOR_DATA);
   SetIndexBuffer(6,Buffer7,INDICATOR_DATA);
   SetIndexBuffer(7,Buffer8,INDICATOR_DATA);
   SetIndexBuffer(8,Buffer9,INDICATOR_DATA);
   SetIndexBuffer(9,Buffer10,INDICATOR_DATA);
   SetIndexBuffer(10,Buffer11,INDICATOR_DATA);
   SetIndexBuffer(11,Buffer12,INDICATOR_DATA);
   SetIndexBuffer(12,Buffer13,INDICATOR_DATA);
   IndicatorSetInteger(INDICATOR_DIGITS,_Digits);
   IndicatorSetString(INDICATOR_SHORTNAME,"Murrey_Math_MT5("+IntegerToString(CalculationPeriod)+")");
   ShiftBarsForward=CalculationPeriod-1;
   for(int i=0;i<13;i++)
     {
      PlotIndexSetInteger(i,PLOT_SHIFT,ShiftBarsForward);
      PlotIndexSetDouble(i,PLOT_EMPTY_VALUE,EMPTY_VALUE);
     }
//---
   return(0);
  }
//+------------------------------------------------------------------+
//| Custom indicator iteration function                              |
//+------------------------------------------------------------------+
int OnCalculate(const int rates_total,
                const int prev_calculated,
                const datetime &time[],
                const double &open[],
                const double &high[],
                const double &low[],
                const double &close[],
                const long &tick_volume[],
                const long &volume[],
                const int &spread[])
  {
//--- check for data
   if(rates_total<CalculationPeriod+StepBack)
      return(0);
   int limit;
   if(prev_calculated==0)
     {
      limit=CalculationPeriod+StepBack;
      ArrayInitialize(Buffer1,EMPTY_VALUE);
      ArrayInitialize(Buffer2,EMPTY_VALUE);
      ArrayInitialize(Buffer3,EMPTY_VALUE);
      ArrayInitialize(Buffer4,EMPTY_VALUE);
      ArrayInitialize(Buffer5,EMPTY_VALUE);
      ArrayInitialize(Buffer6,EMPTY_VALUE);
      ArrayInitialize(Buffer7,EMPTY_VALUE);
      ArrayInitialize(Buffer8,EMPTY_VALUE);
      ArrayInitialize(Buffer9,EMPTY_VALUE);
      ArrayInitialize(Buffer10,EMPTY_VALUE);
      ArrayInitialize(Buffer11,EMPTY_VALUE);
      ArrayInitialize(Buffer12,EMPTY_VALUE);
      ArrayInitialize(Buffer13,EMPTY_VALUE);
     }
   else limit=prev_calculated-1;
//--- calculate Murrey_Math
   for(int i=limit;i<rates_total;i++)
     {
      CalcMurreyMath(i,high,low);
     }
   for(int i=1; i<=ShiftBarsForward; i++)
   {
   Buffer1[rates_total-i]=Buffer1[rates_total-ShiftBarsForward-1];
   Buffer2[rates_total-i]=Buffer2[rates_total-ShiftBarsForward-1];
   Buffer3[rates_total-i]=Buffer3[rates_total-ShiftBarsForward-1];
   Buffer4[rates_total-i]=Buffer4[rates_total-ShiftBarsForward-1];
   Buffer5[rates_total-i]=Buffer5[rates_total-ShiftBarsForward-1];
   Buffer6[rates_total-i]=Buffer6[rates_total-ShiftBarsForward-1];
   Buffer7[rates_total-i]=Buffer7[rates_total-ShiftBarsForward-1];
   Buffer8[rates_total-i]=Buffer8[rates_total-ShiftBarsForward-1];
   Buffer9[rates_total-i]=Buffer9[rates_total-ShiftBarsForward-1];
   Buffer10[rates_total-i]=Buffer10[rates_total-ShiftBarsForward-1];
   Buffer11[rates_total-i]=Buffer11[rates_total-ShiftBarsForward-1];
   Buffer12[rates_total-i]=Buffer12[rates_total-ShiftBarsForward-1];
   Buffer13[rates_total-i]=Buffer13[rates_total-ShiftBarsForward-1];
   }
//--- return value of prev_calculated for next call
   return(rates_total);
  }
//+------------------------------------------------------------------+
//|                                                                  |
//+------------------------------------------------------------------+
void CalcMurreyMath(int index,const double &high[],const double &low[])
  {
   double min=low[ArrayMinimum(low,index-(CalculationPeriod+StepBack),CalculationPeriod+StepBack)];
   double max=high[ArrayMaximum(high,index-(CalculationPeriod+StepBack),CalculationPeriod+StepBack)];
   double fractal=DetermineFractal(max);
   double range=max-min;
   double sum=MathFloor(MathLog(fractal/range)/MathLog(2));
   double octave=fractal*(MathPow(0.5,sum));
   double mn=MathFloor(min/octave)*octave;
   double mx=mx=mn+(2*octave);
   if((mn+octave)>=max)
      mx=mn+octave;
// calculating xx
//x2
   double x2=0;
   if((min>=(3*(mx-mn)/16+mn)) && (max<=(9*(mx-mn)/16+mn)))
      x2=mn+(mx-mn)/2;
//x1
   double x1=0;
   if((min>=(mn-(mx-mn)/8)) && (max<=(5*(mx-mn)/8+mn)) && (x2==0))
      x1=mn+(mx-mn)/2;

//x4
   double x4=0;
   if((min>=(mn+7*(mx-mn)/16)) && (max<=(13*(mx-mn)/16+mn)))
      x4=mn+3*(mx-mn)/4;

//x5
   double x5=0;
   if((min>=(mn+3*(mx-mn)/8)) && (max<=(9*(mx-mn)/8+mn)) && (x4==0))
      x5=mx;

//x3
   double x3=0;
   if((min>=(mn+(mx-mn)/8)) && (max<=(7*(mx-mn)/8+mn)) && (x1==0) && (x2==0) && (x4==0) && (x5==0))
      x3=mn+3*(mx-mn)/4;

//x6
   double x6=0;
   if((x1+x2+x3+x4+x5)==0)
      x6=mx;

   double finalH=x1+x2+x3+x4+x5+x6;
// calculating yy
//y1
   double y1=0;
   if(x1>0)
      y1=mn;

//y2
   double y2=0;
   if(x2>0)
      y2=mn+(mx-mn)/4;

//y3
   double y3=0;
   if(x3>0)
      y3=mn+(mx-mn)/4;

//y4
   double y4=0;
   if(x4>0)
      y4=mn+(mx-mn)/2;

//y5
   double y5=0;
   if(x5>0)
      y5=mn+(mx-mn)/2;

//y6
   double y6=0;
   if((finalH>0) && ((y1+y2+y3+y4+y5)==0))
      y6=mn;
   double finalL = y1+y2+y3+y4+y5+y6;
   double dmml = (finalH-finalL)/8;
   int shift=index-ShiftBarsForward;
   Buffer1[shift]=(finalL-dmml*2); //-2/8
   Buffer2[shift]=Buffer1[shift]+dmml;
   Buffer3[shift]=Buffer2[shift]+dmml;
   Buffer4[shift]=Buffer3[shift]+dmml;
   Buffer5[shift]=Buffer4[shift]+dmml;
   Buffer6[shift]=Buffer5[shift]+dmml;
   Buffer7[shift]=Buffer6[shift]+dmml;
   Buffer8[shift]=Buffer7[shift]+dmml;
   Buffer9[shift]=Buffer8[shift]+dmml;
   Buffer10[shift]=Buffer9[shift]+dmml;
   Buffer11[shift]=Buffer10[shift]+dmml;
   Buffer12[shift]=Buffer11[shift]+dmml;
   Buffer13[shift]=Buffer12[shift]+dmml;
   //EMPTY_VALUE
   if(Buffer1[shift]!=Buffer1[shift-1]) Buffer1[shift-1]=EMPTY_VALUE;
   if(Buffer2[shift]!=Buffer2[shift-1]) Buffer2[shift-1]=EMPTY_VALUE;
   if(Buffer3[shift]!=Buffer3[shift-1]) Buffer3[shift-1]=EMPTY_VALUE;
   if(Buffer4[shift]!=Buffer4[shift-1]) Buffer4[shift-1]=EMPTY_VALUE;
   if(Buffer5[shift]!=Buffer5[shift-1]) Buffer5[shift-1]=EMPTY_VALUE;
   if(Buffer6[shift]!=Buffer6[shift-1]) Buffer6[shift-1]=EMPTY_VALUE;
   if(Buffer7[shift]!=Buffer7[shift-1]) Buffer7[shift-1]=EMPTY_VALUE;
   if(Buffer8[shift]!=Buffer8[shift-1]) Buffer8[shift-1]=EMPTY_VALUE;
   if(Buffer9[shift]!=Buffer9[shift-1]) Buffer9[shift-1]=EMPTY_VALUE;
   if(Buffer10[shift]!=Buffer10[shift-1]) Buffer10[shift-1]=EMPTY_VALUE;
   if(Buffer11[shift]!=Buffer11[shift-1]) Buffer11[shift-1]=EMPTY_VALUE;
   if(Buffer12[shift]!=Buffer12[shift-1]) Buffer12[shift-1]=EMPTY_VALUE;
   if(Buffer13[shift]!=Buffer13[shift-1]) Buffer13[shift-1]=EMPTY_VALUE;
  }
//+------------------------------------------------------------------+
//|                                                                  |
//+------------------------------------------------------------------+
double DetermineFractal(double v)
  {
   if(v<=250000 && v>25000)
      return(100000);
   if(v<=25000 && v>2500)
      return(10000);
   if(v<=2500 && v>250)
      return(1000);
   if(v<=250 && v>25)
      return(100);
   if(v<<=25 && v>12.5)
      return(12.5);
   if(v<=12.5 && v>6.25)
      return(12.5);
   if(v<=6.25 && v>3.125)
      return(6.25);
   if(v<=3.125 && v>1.5625)
      return(3.125);
   if(v<=1.5625 && v>0.390625)
      return(1.5625);
   if(v<=0.390625 && v>0)
      return(0.1953125);
   return(0);
  }
//+------------------------------------------------------------------+


【表示結果】


Back to Meta Trader


