


【解説】【MQL5 community】 Pivot : サポート、レジスタンスを表示し、それを基準として、売買を行うための指標。
【計算法】
データは前日のものを使用する。
■Resistance 3 = High + 2*(Pivot - Low)
■Resistance 2 = Pivot + (R1 - S1)
■Resistance 1 = 2 * Pivot - Low
■Pivot Point = ( High + Close + Low )/3
■Support 1 = 2 * Pivot - High
■Support 2 = Pivot - (R1 - S1)
■Support 3 = Low - 2*(High - Pivot)
【シグナル】
これらのラインを基準として、売買を行う。 価格がサポートラインに来たところで買い、レジスタンスラインに来たところで売りです。 もし、第1のサポート・レジスタンスで仕掛けた時の値幅があまりない、あるいはもっと安く(高く)買い(売り)たい時には、第2サポート・レジスタンスまで待つ、という選択肢もあります。
//+------------------------------------------------------------------+
//| Pivot.mq5 |
//| Copyright 2010, okh |
//| csharp.okh@gmail.com |
//+------------------------------------------------------------------+
#property copyright "2010, MetaQuotes Software Corp."
#property link "http://www.mql5.com"
#property version "1.00"
#property indicator_chart_window
#property indicator_buffers 7
#property indicator_plots 7
//--- plot Pivot
#property indicator_label1 "Pivot"
#property indicator_type1 DRAW_LINE
#property indicator_color1 DarkOrange
#property indicator_style1 STYLE_SOLID
#property indicator_width1 2
//--- plot R1
#property indicator_label2 "R1"
#property indicator_type2 DRAW_LINE
#property indicator_color2 LimeGreen
#property indicator_style2 STYLE_SOLID
#property indicator_width2 3
//--- plot R2
#property indicator_label3 "R2"
#property indicator_type3 DRAW_LINE
#property indicator_color3 LimeGreen
#property indicator_style3 STYLE_SOLID
#property indicator_width3 2
//--- plot R3
#property indicator_label4 "R3"
#property indicator_type4 DRAW_LINE
#property indicator_color4 LimeGreen
#property indicator_style4 STYLE_SOLID
#property indicator_width4 1
//--- plot S1
#property indicator_label5 "S1"
#property indicator_type5 DRAW_LINE
#property indicator_color5 Red
#property indicator_style5 STYLE_SOLID
#property indicator_width5 3
//--- plot S2
#property indicator_label6 "S2"
#property indicator_type6 DRAW_LINE
#property indicator_color6 Red
#property indicator_style6 STYLE_SOLID
#property indicator_width6 2
//--- plot S3
#property indicator_label7 "S3"
#property indicator_type7 DRAW_LINE
#property indicator_color7 Red
#property indicator_style7 STYLE_SOLID
#property indicator_width7 1
//--- indicator buffers
double PivotBuffer[];
double R1Buffer[];
double R2Buffer[];
double R3Buffer[];
double S1Buffer[];
double S2Buffer[];
double S3Buffer[];
//+------------------------------------------------------------------+
//| Custom indicator initialization function |
//+------------------------------------------------------------------+
int OnInit()
{
//--- indicator buffers mapping
SetIndexBuffer(0,PivotBuffer,INDICATOR_DATA);
SetIndexBuffer(1,R1Buffer,INDICATOR_DATA);
SetIndexBuffer(2,R2Buffer,INDICATOR_DATA);
SetIndexBuffer(3,R3Buffer,INDICATOR_DATA);
SetIndexBuffer(4,S1Buffer,INDICATOR_DATA);
SetIndexBuffer(5,S2Buffer,INDICATOR_DATA);
SetIndexBuffer(6,S3Buffer,INDICATOR_DATA);
//---
return(0);
}
//+------------------------------------------------------------------+
//| Custom indicator iteration function |
//+------------------------------------------------------------------+
int OnCalculate(const int rates_total,
const int prev_calculated,
const datetime &time[],
const double &open[],
const double &high[],
const double &low[],
const double &close[],
const long &tick_volume[],
const long &volume[],
const int &spread[])
{
//---
MqlRates rates[];
ArraySetAsSeries(rates,true);
int copied=CopyRates(Symbol(),PERIOD_D1,0,2,rates);
double pivot=(rates[1].high+rates[1].close+rates[1].low)/3;
double r1 = (2 * pivot) - rates[1].low;
double s1 = (2 * pivot) - rates[1].high;
double r2 = pivot + (r1 - s1);
double r3 = rates[1].high + (2* (pivot - rates[1].low));
double s2 = pivot - (r1 - s1);
double s3 = rates[1].low - (2*(rates[1].high - pivot));
int pos=prev_calculated-1;
if(pos<0) pos=0;
for(int i=pos; i<rates_total; i++)
{
PivotBuffer[i]=pivot;
R1Buffer[i] = r1;
R2Buffer[i] = r2;
R3Buffer[i] = r3;
S1Buffer[i] = s1;
S2Buffer[i] = s2;
S2Buffer[i] = s3;
}
//--- return value of prev_calculated for next call
return(rates_total);
}
//+------------------------------------------------------------------+
【表示結果】
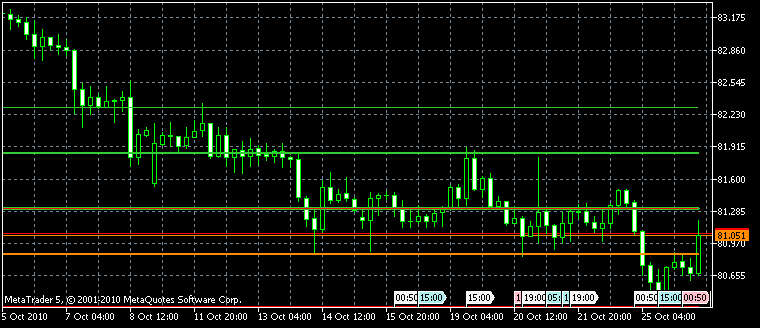
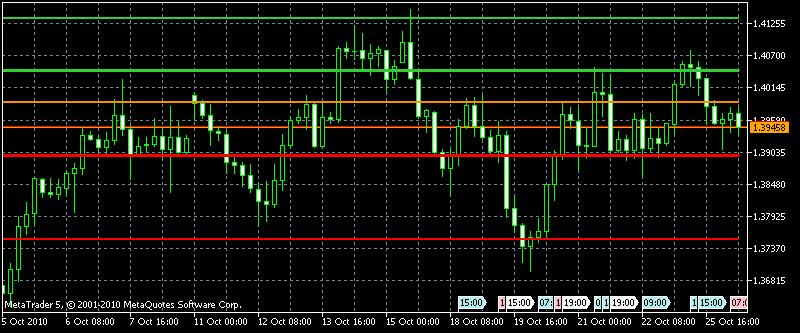
4時間足。昨日のデータを使うことからある程度長い期間のデータが必要。
Back to Meta Trader