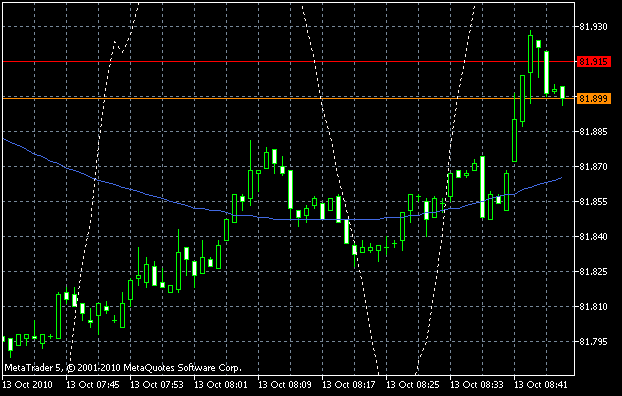
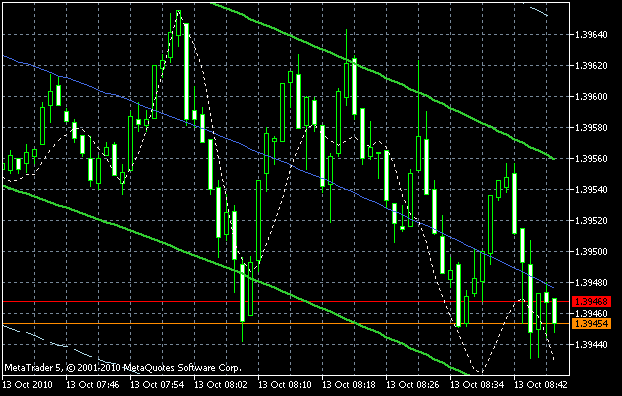
【解説】【MQL5 community】 Plombiers - oscillator in the channel: Plombiersとはフランス語で、「配管」を意味する。
ここでは、平均(Means)、レジスタンス(Resistance)、サポート(Support)を表示する。またSignalを移動平均と同様に使うことによりシグナルと見ることができます。
//+------------------------------------------------------------------+
//|                                                    Plombiers.mq5 |
//|                         Copyright 2009-20010, Avatara@bigmir.net |
//+------------------------------------------------------------------+
#property copyright "2009-2010, Avatara@bigmir.net"
#property link      "Avatara@bigmir.net"
#property version   "1.00"//22/11/09
//regression  copyright "ANG3110@latchess.com"
#property description "Constructing a stochastic oscillator in the"
#property description "channel  where  the channel  walls formed a "
#property description "standard deviation of an arbitrary polynomial,"
#property description "which is approximated  least  squares."
#property description "_____________________________________"
#property indicator_chart_window
#property indicator_buffers 6
#property indicator_plots   6
//---- plot Means
#property indicator_label1  "Means"
#property indicator_type1   DRAW_LINE
#property indicator_color1  RoyalBlue
#property indicator_style1  STYLE_SOLID
#property indicator_width1  1
//---- plot Label2
#property indicator_label2  "Resistance"
#property indicator_type2   DRAW_LINE
#property indicator_color2  LimeGreen
#property indicator_style2  STYLE_SOLID
#property indicator_width2  2
//---- plot Label3
#property indicator_label3  "Support"
#property indicator_type3   DRAW_LINE
#property indicator_color3  LimeGreen
#property indicator_style3  STYLE_SOLID
#property indicator_width3  2
//---- plot Label4
#property indicator_label4  "Resistance+"
#property indicator_type4   DRAW_LINE
#property indicator_color4  LightBlue
#property indicator_style4  STYLE_DASH
#property indicator_width4  1
//---- plot Label5
#property indicator_label5  "Support-"
#property indicator_type5   DRAW_LINE
#property indicator_color5  LightBlue
#property indicator_style5  STYLE_DASH
#property indicator_width5  1
//---- plot Label6
#property indicator_label6  "Signal"
#property indicator_type6   DRAW_LINE
#property indicator_color6  Seashell
#property indicator_style6  STYLE_DOT
#property indicator_width6  1
//-----------------------------------
enum intType
  {
   i0 = 0, // 0 - simple average
   i1 = 1, // 1 - straight line
   i2 = 2, // parabola 2-nd degrees
   i3 = 3, // parabola 3-d degrees
   i4 = 4  // 4-th degrees
  };
//--- input parameters ------
input int  bars_IN = 145;   // data length
input intType SP = i2;      // curve's order
input int N_Shift1 = 0;     // shift back into the history
input int Forecast=0;       // length of channel into the "future"
input double kstd = 2.1415; // standart deviation factor
input bool Oscilator=true;  // Is oscillator on the display?
input int N_Buff=1;         // displayed oscillator's buffer
input int Ka=21;            // Line calculation period %K.
input int La=7;             // Averaging period %D
input int Za=1;             // Deceleration
input ENUM_MA_METHOD Oe=MODE_SMA; // Averaging method
input ENUM_STO_PRICE Me=STO_CLOSECLOSE;  // Stochastic's price value

input int DIGf = -99; // Number of decimal points.-99 Digits
string sName="Plombiers 1.0";
//--------------------------
double ai[12][12],b[12],x[12],sx[12];
double sum,Mnog,COG[];
int    N,i,N1,j,k,LM,hOsc,Dig,hFl,N_Shift;
double qq,mm,tt,sq,std;
//--- indicator buffers
double         Means[];
double         level1h[];
double         level1l[];
double         level2h[];
double         level2l[];
double         S[];
//+------------------------------------------------------------------+
//| Custom indicator initialization function                         |
//+------------------------------------------------------------------+
int OnInit()
  {
//--- indicator buffers mapping
   SetIndexBuffer(0,Means,INDICATOR_DATA);
   SetIndexBuffer(1,level1h,INDICATOR_DATA);
   SetIndexBuffer(2,level1l,INDICATOR_DATA);
   SetIndexBuffer(3,level2h,INDICATOR_DATA);
   SetIndexBuffer(4,level2l,INDICATOR_DATA);
   SetIndexBuffer(5,S,INDICATOR_DATA);
   ArraySetAsSeries(Means,true);ArraySetAsSeries(S,true);
   ArraySetAsSeries(level1h,true);ArraySetAsSeries(level2h,true);
   ArraySetAsSeries(level1l,true);ArraySetAsSeries(level2l,true);
//--- set accuracy
   IndicatorSetInteger(INDICATOR_DIGITS,Digits());
   N_Shift=N_Shift1;
   if(N_Shift<0)N_Shift=-N_Shift;
   N=bars_IN+N_Shift;
   N1=Bars(Symbol(),PERIOD_CURRENT);
   if(N1<N)N=N1;
      else N1=N;
   sName=sName+" ("+IntegerToString(bars_IN,4)+","
             +IntegerToString(N_Shift,3)+","
             +IntegerToString(Forecast,3)+")";
   if(DIGf<0) Dig=Digits();
      else Dig=DIGf;
//---- line shifts when drawing
   PlotIndexSetInteger(0,PLOT_SHIFT,Forecast);
   PlotIndexSetInteger(1,PLOT_SHIFT,Forecast);
   PlotIndexSetInteger(2,PLOT_SHIFT,Forecast);
   PlotIndexSetInteger(3,PLOT_SHIFT,Forecast);
   PlotIndexSetInteger(4,PLOT_SHIFT,Forecast);
   PlotIndexSetInteger(5,PLOT_SHIFT,Forecast);
//--- sets first bar from what index will be drawn
   PlotIndexSetInteger(0,PLOT_DRAW_BEGIN,N1+Forecast);
   PlotIndexSetInteger(1,PLOT_DRAW_BEGIN,N1+Forecast);
   PlotIndexSetInteger(2,PLOT_DRAW_BEGIN,N1+Forecast);
   PlotIndexSetInteger(3,PLOT_DRAW_BEGIN,N1+Forecast);
   PlotIndexSetInteger(4,PLOT_DRAW_BEGIN,N1+Forecast);
   PlotIndexSetInteger(5,PLOT_DRAW_BEGIN,N1+Forecast);
//--- name for DataWindow and indicator subwindow label
  IndicatorSetString(INDICATOR_SHORTNAME,sName);
//--- set drawing line empty value
   PlotIndexSetDouble(0,PLOT_EMPTY_VALUE,0.0);
   PlotIndexSetDouble(1,PLOT_EMPTY_VALUE,0.0);
   PlotIndexSetDouble(2,PLOT_EMPTY_VALUE,0.0);
   PlotIndexSetDouble(3,PLOT_EMPTY_VALUE,0.0);
   PlotIndexSetDouble(4,PLOT_EMPTY_VALUE,0.0);
   PlotIndexSetDouble(5,PLOT_EMPTY_VALUE,0.0);
//--- initialization done
   hOsc=iStochastic(Symbol(),Period(),Ka,La,Za,Oe,Me);
   return(0);
  }
//+------------------------------------------------------------------+
//| DEINIT                                                           |
//+------------------------------------------------------------------+
int deinit()
  {
   return(0);
  }
//+------------------------------------------------------------------+
//| Custom indicator iteration function                              |
//+------------------------------------------------------------------+
int OnCalculate(const int rates_total,
                const int prev_calculated,
                const int begin,
                const double &price[])
  {
   int mi;
   N1=rates_total;
   N=bars_IN+N_Shift;
   if(N1<N)
     {
      N1=bars_IN+N1-N;
      N=N1;N1=N+1;
      Print("Not presentative DATA! bars present ",N);
     }
   else N1=bars_IN+1;
   if(!ArrayGetAsSeries(price))
      ArraySetAsSeries(price,true);
   int copied=CopyBuffer(hOsc,N_Buff,N_Shift,N1-1,S);
   if(copied<=0)
     {
      Print("Unable to copy indicator's value. Error =",
            GetLastError(),",  copied =",copied);
      return(0);
     }
//+------------------------------------------------------------------+
   sx[1]=double(N1-1.0);
  for(mi=1;mi<=(SP+1)*2-2;mi++)
     {
      sum=0;
      for(i=N_Shift;i<N;i++)
        {
         sum+=MathPow(i,mi);
        }
      sx[mi+1]=sum;
     }
//+------------------------------------------------------------------+
   for(mi=1;mi<=(SP+1);mi++)
     {
      sum=0.00000;
      for(i=N_Shift;i<N;i++)
        {
         if(mi==1)sum+=price[i];
         else sum+=price[i]*MathPow(i,mi-1);
        }
      b[mi]=sum;
     }
//=============Matrix===================
   for(j=1;j<=SP+1;j++)
     {
      for(i=1;i<=SP+1;i++)
        {
         k=i+j-1;
         ai[i][j]=sx[k];
        }
     }
//=============Gauss====================
   for(k=1;k<=SP;k++)
     {
      LM=0; mm=0;
      for(i=k;i<=SP+1;i++)
        {
         if(MathAbs(ai[i][k])>mm)
           {
            mm=MathAbs(ai[i][k]);
            LM=i;
           }
        }
      if(LM==0)return(0);
      if(LM!=k)
        {
         for(j=1;j<=SP+1;j++)
           {
            tt=ai[k][j];
            ai[k][j]=ai[LM][j];
            ai[LM][j]=tt;
           }
         tt=b[k]; b[k]=b[LM]; b[LM]=tt;
        }
      for(i=k+1;i<=SP+1;i++)
        {
         if(MathAbs(ai[k][k])>0.00001)
           {
            qq=ai[i][k]/ai[k][k];
           }
         else qq=1.0;
         for(j=1;j<=SP+1;j++)
           {
            if(j==k)
              {
               ai[i][j]=0.0;
              }
            else
              {
               ai[i][j]=ai[i][j]-qq*ai[k][j];
              }
           }
         b[i]=b[i]-qq*b[k];
        }
     }
   k=SP+1;
   if(ai[k][k]==0.0)
     {
      Print("singular");
      return(rates_total);
     }
   x[k]=b[k]/ai[k][k];

   for(i=SP;i>=1;i--)
     {
      tt=0.0;
      for(j=1;j<=k-i;j++)
        {
         tt=tt+ai[i][i+j]*x[i+j];
         x[i]=(1.0/ai[i][i])*(b[i]-tt);
        }
     }
//+------------------------------------------------------------------+
   for(i=N_Shift-Forecast;i<N;i++)
     {
      sum=0;
      for(k=1;k<=SP;k++)
        {
         sum+=x[k+1]*MathPow(i,k);
        }
      Means[i+Forecast]=NormalizeDouble(x[1]+sum,Dig);
     }
//-----------------------------------Std----------------------------
   sq=0.0;
   for(i=N_Shift;i<N;i++)
     {
      qq=(price[i-N_Shift]-Means[i+Forecast]);
      sq+=qq*qq;
     }
   tt=double(N1-1);
   sq= MathSqrt(sq/(tt)) * kstd;
   std=myStdDev(N1-1,price,N_Shift)*kstd;
   for(i=N_Shift-Forecast;i<N;i++)
     {
      level1h[i+Forecast] = Means[i+Forecast] + sq;
      level1l[i+Forecast] = Means[i+Forecast] - sq;
      level2h[i+Forecast] = Means[i+Forecast] + std;
      level2l[i+Forecast] = Means[i+Forecast] - std;
     }
   if(Oscilator)
     {
      for(i=N-1 ;i>=N_Shift;i--)
        { S[i+Forecast]=Means[i+Forecast]+sq*(S[i]-50.0)/44.9999;}
      for(i=0;i<N_Shift+Forecast;i++)S[i]=0.0;
     }
   return(rates_total);
  }
//+------------------------------------------------------------------+
//|                                                                  |
//+------------------------------------------------------------------+
double myStdDev(int period_N, const double  &Cena[], int Shift)
  {
   double sum,sred,std;
   int j,k=period_N-1;
   sum=0.0;std=0.0;
   for(j=0;j<period_N;j++)
     {
      sum+=Cena[j+Shift];
     }
   sred=sum/period_N ;
   for(j=0;j<period_N;j++)
     {
      sum=Cena[j+Shift]-sred;
      std+=sum*sum;
     }
   sum=std/k;
   std=MathSqrt(sum);
   return(std);
  }
//+------------------------------------------------------------------+


【表示結果】


Back to Meta Trader


