


【解説】 【MQL5 community】 Relative Strength Index (相対力指数): 相場の買われ過ぎ,売られ過ぎを判断する一つの指針として用いられる。
【計算法】
RSI(n)=直近n期間の値上がり幅の平均÷(直近n期間の値上げ幅の平均+直近n期間の値下げ幅の平均)
【シグナル】
一般にRSIが70%を超えると買われすぎで「売りシグナル」。 30%を下回ると売られすぎで「買いシグナル」
またRSIでは逆行現象(ダイバージェンシー)と呼ばれる相場とRSIが反対の方向に動く現象が発生することがあります。この逆行現象と呼ばれる現象が30%以下または70%以上の時に発生すると、相場のトレンドが終了することを示唆していると言われています。
//+------------------------------------------------------------------+
//| RSI.mq5 |
//| Copyright 2009, MetaQuotes Software Corp. |
//| http://www.mql5.com |
//+------------------------------------------------------------------+
#property copyright "2009, MetaQuotes Software Corp."
#property link "http://www.mql5.com"
#property description "Relative Strength Index"
//--- indicator settings
#property indicator_separate_window
#property indicator_minimum 0
#property indicator_maximum 100
#property indicator_level1 30
#property indicator_level2 70
#property indicator_buffers 3
#property indicator_plots 1
#property indicator_type1 DRAW_LINE
#property indicator_color1 DodgerBlue
//--- input parameters
input int InpPeriodRSI=14; // Period
//--- indicator buffers
double ExtRSIBuffer[];
double ExtPosBuffer[];
double ExtNegBuffer[];
//--- global variable
int ExtPeriodRSI;
//+------------------------------------------------------------------+
//| Custom indicator initialization function |
//+------------------------------------------------------------------+
void OnInit()
{
//--- check for input
if(InpPeriodRSI<1)
{
ExtPeriodRSI=12;
Print("Incorrect value for input variable InpPeriodRSI =",InpPeriodRSI,
"Indicator will use value =",ExtPeriodRSI,"for calculations.");
}
else ExtPeriodRSI=InpPeriodRSI;
//--- indicator buffers mapping
SetIndexBuffer(0,ExtRSIBuffer,INDICATOR_DATA);
SetIndexBuffer(1,ExtPosBuffer,INDICATOR_CALCULATIONS);
SetIndexBuffer(2,ExtNegBuffer,INDICATOR_CALCULATIONS);
//--- set accuracy
IndicatorSetInteger(INDICATOR_DIGITS,2);
//--- sets first bar from what index will be drawn
PlotIndexSetInteger(0,PLOT_DRAW_BEGIN,ExtPeriodRSI);
//--- name for DataWindow and indicator subwindow label
IndicatorSetString(INDICATOR_SHORTNAME,"RSI("+string(ExtPeriodRSI)+")");
//--- initialization done
}
//+------------------------------------------------------------------+
//| Relative Strength Index |
//+------------------------------------------------------------------+
int OnCalculate(const int rates_total,
const int prev_calculated,
const int begin,
const double &price[])
{
int i;
double diff;
//--- check for rates count
if(rates_total<=ExtPeriodRSI)
return(0);
//--- preliminary calculations
int pos=prev_calculated-1;
if(pos<=ExtPeriodRSI)
{
//--- first RSIPeriod values of the indicator are not calculated
ExtRSIBuffer[0]=0.0;
ExtPosBuffer[0]=0.0;
ExtNegBuffer[0]=0.0;
double SumP=0.0;
double SumN=0.0;
for(i=1;i<=ExtPeriodRSI;i++)
{
ExtRSIBuffer[i]=0.0;
ExtPosBuffer[i]=0.0;
ExtNegBuffer[i]=0.0;
diff=price[i]-price[i-1];
SumP+=(diff>0?diff:0);
SumN+=(diff<0?-diff:0);
}
//--- calculate first visible value
ExtPosBuffer[ExtPeriodRSI]=SumP/ExtPeriodRSI;
ExtNegBuffer[ExtPeriodRSI]=SumN/ExtPeriodRSI;
ExtRSIBuffer[ExtPeriodRSI]=100.0-(100.0/(1.0+ExtPosBuffer[ExtPeriodRSI]/ExtNegBuffer[ExtPeriodRSI]));
//--- prepare the position value for main calculation
pos=ExtPeriodRSI+1;
}
//--- the main loop of calculations
for(i=pos;i<rates_total;i++)
{
diff=price[i]-price[i-1];
ExtPosBuffer[i]=(ExtPosBuffer[i-1]*(ExtPeriodRSI-1)+(diff>0.0?diff:0.0))/ExtPeriodRSI;
ExtNegBuffer[i]=(ExtNegBuffer[i-1]*(ExtPeriodRSI-1)+(diff<0.0?-diff:0.0))/ExtPeriodRSI;
ExtRSIBuffer[i]=100.0-100.0/(1+ExtPosBuffer[i]/ExtNegBuffer[i]);
}
//--- OnCalculate done. Return new prev_calculated.
return(rates_total);
}
//+------------------------------------------------------------------+
【表示結果】
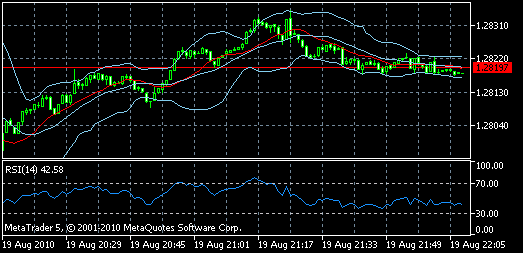
1か所70%を超え、売りシグナルが出ている。確かにその後から下にいっている。
レンジ相場に有効だと思われる。
Back to Meta Trader