


【解説】【MQL5 community】 Relative Vigor Index (相対活性指数): 上昇トレンドでは終値が始値より高く、 下降トレンドではその逆であることを元にした分析ツールです。 市場の活動具合を判断するのに用います。
【計算法】
基本的な考え方: RVI = (終値 - 始値) / (高値 - 低値)
上のものを期間における加重平均を使って、拡張したものがRVIである。
RVI:
1)終値と始値の差の加重平均:
MovAverage = (N期の終値-N期の始値) + 2 * (N-1期の終値 - N-1期の始値) + 2 * (N-2期の終値 - N-2期の始値) + (N-3期の終値 - N-3期の始値)
2)高値と低値の差の加重平均:
RangeAverage = (N期の高値-N期の低値) + 2 x (N-1期の高値 - N-1期の低値) + 2 x (N-2期の高値 - N-2期の低値) + (N-3期の高値 - N-3期の低値),
RVIaverage = (Σ_{l=1}^4 MoveAverage_i)/(Σ_{l=1}^4 RangeAverage_i)
シグナル:
RVIsignal = (N期のRVIaverage + 2 * N-1期のRVIaverage + 2 * N-2期のRVIaverage + N-3期のRVIaverage)/6
【シグナル】
一般にRVIがRVIシグナルを下から上に抜けたら買いシグナル、 上から下に抜けたら売りシグナル。
//+------------------------------------------------------------------+
//| RVI.mq5 |
//| Copyright 2009, MetaQuotes Software Corp. |
//| http://www.mql5.com |
//+------------------------------------------------------------------+
#property copyright "2009, MetaQuotes Software Corp."
#property link "http://www.mql5.com"
#property description "Relative Vigor Index"
//--- indicator settings
#property indicator_separate_window
#property indicator_buffers 2
#property indicator_plots 2
#property indicator_type1 DRAW_LINE
#property indicator_type2 DRAW_LINE
#property indicator_color1 Green
#property indicator_color2 Red
#property indicator_label1 "RVI"
#property indicator_label2 "Signal"
//--- input parameters
input int InpRVIPeriod=10; // Period
//--- indicator buffers
double ExtRVIBuffer[];
double ExtSignalBuffer[];
//---
#define TRIANGLE_PERIOD 3
#define AVERAGE_PERIOD (TRIANGLE_PERIOD*2)
//+------------------------------------------------------------------+
//| Custom indicator initialization function |
//+------------------------------------------------------------------+
void OnInit()
{
//--- indicator buffers mapping
SetIndexBuffer(0,ExtRVIBuffer,INDICATOR_DATA);
SetIndexBuffer(1,ExtSignalBuffer,INDICATOR_DATA);
IndicatorSetInteger(INDICATOR_DIGITS,3);
//--- sets first bar from what index will be drawn
PlotIndexSetInteger(0,PLOT_DRAW_BEGIN,(InpRVIPeriod-1)+TRIANGLE_PERIOD);
PlotIndexSetInteger(1,PLOT_DRAW_BEGIN,(InpRVIPeriod-1)+AVERAGE_PERIOD);
//--- name for DataWindow and indicator subwindow label
IndicatorSetString(INDICATOR_SHORTNAME,"RVI("+string(InpRVIPeriod)+")");
PlotIndexSetString(0,PLOT_LABEL,"RVI("+string(InpRVIPeriod)+")");
PlotIndexSetString(1,PLOT_LABEL,"Signal("+string(InpRVIPeriod)+")");
//--- initialization done
}
//+------------------------------------------------------------------+
//| Relative Vigor Index |
//+------------------------------------------------------------------+
int OnCalculate(const int rates_total,const int prev_calculated,
const datetime &Time[],
const double &Open[],
const double &High[],
const double &Low[],
const double &Close[],
const long &TickVolume[],
const long &Volume[],
const int &Spread[])
{
int i,j,nLimit;
double dValueUp,dValueDown,dNum,dDeNum;
//--- check for bars count
if(rates_total<=InpRVIPeriod+AVERAGE_PERIOD+2) return(0); // exit with zero result
//--- check for possible errors
if(prev_calculated<0) return(0); // exit with zero result
//--- last counted bar will be recounted
nLimit=InpRVIPeriod+2;
if(prev_calculated>InpRVIPeriod+TRIANGLE_PERIOD+2)
nLimit=prev_calculated-1;
//--- set empty value for uncalculated bars
if(prev_calculated==0)
{
for(i=0;i<InpRVIPeriod+TRIANGLE_PERIOD;i++) ExtRVIBuffer[i]=0.0;
for(i=0;i<InpRVIPeriod+AVERAGE_PERIOD;i++) ExtSignalBuffer[i]=0.0;
}
//--- RVI counted in the 1-st buffer
for(i=nLimit;i<rates_total;i++)
{
dNum=0.0;
dDeNum=0.0;
for(j=i;j>i-InpRVIPeriod;j--)
{
dValueUp=Close[j]-Open[j]+2*(Close[j-1]-Open[j-1])+2*(Close[j-2]-Open[j-2])+Close[j-3]-Open[j-3];
dValueDown=High[j]-Low[j]+2*(High[j-1]-Low[j-1])+2*(High[j-2]-Low[j-2])+High[j-3]-Low[j-3];
dNum+=dValueUp;
dDeNum+=dValueDown;
}
if(dDeNum!=0.0)
ExtRVIBuffer[i]=dNum/dDeNum;
else
ExtRVIBuffer[i]=dNum;
}
//--- signal line counted in the 2-nd buffer
nLimit=InpRVIPeriod+TRIANGLE_PERIOD+2;
if(prev_calculated>InpRVIPeriod+AVERAGE_PERIOD+2)
nLimit=prev_calculated-1;
for(i=nLimit;i<rates_total;i++) ExtSignalBuffer[i]=(ExtRVIBuffer[i]+2*ExtRVIBuffer[i-1]+2*ExtRVIBuffer[i-2]+ExtRVIBuffer[i-3])/AVERAGE_PERIOD;
//--- OnCalculate done. Return new prev_calculated.
return(rates_total);
}
//+------------------------------------------------------------------+
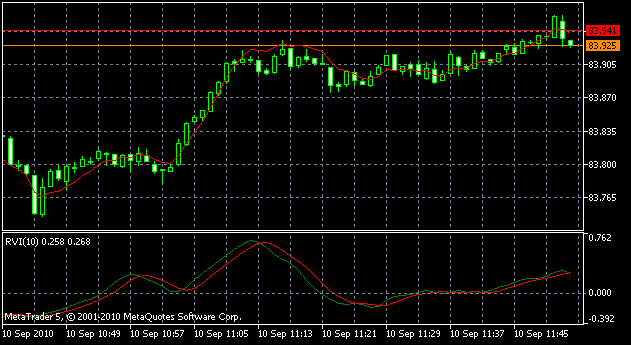
【表示結果】

Back to Meta Trader