


【解説】 【MQL5 community】 Stochastic (ストキャスティクス):レンジ相場の時に有効といわれ, 買われ過ぎ、売られ過ぎを判断する指標である.
短期線:Fast%K(n)=(当日終値−n期間の最安値)÷(n期間の最高値−n期間の最安値)×100(%)
中期線:Fast%D(n)=(当日終値−n期間の最安値)のm期間合計÷(n期間の最高値−n期間の最安値)のm期間合計×100(%)
長期線:Slow%D(I)=Fast%DのI期間の移動平均
【シグナル】
「買いゾーン(20%以下)において、%Kが%Dを下から上へ抜けたときが売られ過ぎのサインで、買い」
「売りゾーン(80%以上)において、%Kが%Dを上から下へ抜けたときが買われ過ぎのサイン、売り」、
//+------------------------------------------------------------------+
//|                                                   Stochastic.mq5 |
//|                        Copyright 2009, MetaQuotes Software Corp. |
//|                                              http://www.mql5.com |
//+------------------------------------------------------------------+
#property copyright "2009, MetaQuotes Software Corp."
#property link      "http://www.mql5.com"
//--- indicator settings
#property indicator_separate_window
#property indicator_buffers 4
#property indicator_plots   2
#property indicator_type1   DRAW_LINE
#property indicator_type2   DRAW_LINE
#property indicator_color1  LightSeaGreen
#property indicator_color2  Red
#property indicator_style2  STYLE_DOT
//--- input parameters
input int InpKPeriod=5;  // K period
input int InpDPeriod=3;  // D period
input int InpSlowing=3;  // Slowing
//--- indicator buffers
double    ExtMainBuffer[];
double    ExtSignalBuffer[];
double    ExtHighesBuffer[];
double    ExtLowesBuffer[];
//+------------------------------------------------------------------+
//| Custom indicator initialization function                         |
//+------------------------------------------------------------------+
void OnInit()
  {
//--- indicator buffers mapping
   SetIndexBuffer(0,ExtMainBuffer,INDICATOR_DATA);
   SetIndexBuffer(1,ExtSignalBuffer,INDICATOR_DATA);
   SetIndexBuffer(2,ExtHighesBuffer,INDICATOR_CALCULATIONS);
   SetIndexBuffer(3,ExtLowesBuffer,INDICATOR_CALCULATIONS);
//--- set accuracy
   IndicatorSetInteger(INDICATOR_DIGITS,2);
//--- set levels
   IndicatorSetInteger(INDICATOR_LEVELS,2);
   IndicatorSetDouble(INDICATOR_LEVELVALUE,0,20);
   IndicatorSetDouble(INDICATOR_LEVELVALUE,1,80);
//--- set maximum and minimum for subwindow
   IndicatorSetDouble(INDICATOR_MINIMUM,0);
   IndicatorSetDouble(INDICATOR_MAXIMUM,100);
//--- name for DataWindow and indicator subwindow label
   IndicatorSetString(INDICATOR_SHORTNAME,"Stoch("+(string)InpKPeriod+","+(string)InpDPeriod+","+(string)InpSlowing+")");
   PlotIndexSetString(0,PLOT_LABEL,"Main");
   PlotIndexSetString(1,PLOT_LABEL,"Signal");
//--- sets first bar from what index will be drawn
   PlotIndexSetInteger(0,PLOT_DRAW_BEGIN,InpKPeriod+InpSlowing-2);
   PlotIndexSetInteger(1,PLOT_DRAW_BEGIN,InpKPeriod+InpDPeriod);
//--- initialization done
  }
//+------------------------------------------------------------------+
//| Stochastic Oscillator                                            |
//+------------------------------------------------------------------+
int OnCalculate(const int rates_total,const int prev_calculated,
                const datetime &Time[],
                const double &Open[],
                const double &High[],
                const double &Low[],
                const double &Close[],
                const long &TickVolume[],
                const long &Volume[],
                const int &Spread[])
  {
   int i,k,start;
//--- check for bars count
   if(rates_total<=InpKPeriod+InpDPeriod+InpSlowing)
      return(0);
//---
   start=InpKPeriod-1;
   if(start+1<prev_calculated) start=prev_calculated-2;
   else
     {
      for(i=0;i<start;i++)
        {
         ExtLowesBuffer[i]=0.0;
         ExtHighesBuffer[i]=0.0;
        }
     }
//--- calculate HighesBuffer[] and ExtHighesBuffer[]
   for(i=start;i<rates_total;i++)
     {
      double dmin=1000000.0;
      double dmax=-1000000.0;
      for(k=i-InpKPeriod+1;k<=i;k++)
        {
         if(dmin>Low[k])  dmin=Low[k];
         if(dmax<High[k]) dmax=High[k];
        }
      ExtLowesBuffer[i]=dmin;
      ExtHighesBuffer[i]=dmax;
     }
//--- %K
   start=InpKPeriod-1+InpSlowing-1;
   if(start+1<prev_calculated) start=prev_calculated-2;
   else
     {
      for(i=0;i<start;i++) ExtMainBuffer[i]=0.0;
     }
//--- main cycle
   for(i=start;i<rates_total;i++)
     {
      double sumlow=0.0;
      double sumhigh=0.0;
      for(k=(i-InpSlowing+1);k<=i;k++)
        {
         sumlow +=(Close[k]-ExtLowesBuffer[k]);
         sumhigh+=(ExtHighesBuffer[k]-ExtLowesBuffer[k]);
        }
      if(sumhigh==0.0) ExtMainBuffer[i]=100.0;
      else             ExtMainBuffer[i]=sumlow/sumhigh*100;
     }
//--- signal
   start=InpDPeriod-1;
   if(start+1<prev_calculated) start=prev_calculated-2;
   else
     {
      for(i=0;i<start;i++) ExtSignalBuffer[i]=0.0;
     }
   for(i=start;i<rates_total;i++)
     {
      double sum=0.0;
      for(k=0;k<InpDPeriod;k++) sum+=ExtMainBuffer[i-k];
      ExtSignalBuffer[i]=sum/InpDPeriod;
     }
//--- OnCalculate done. Return new prev_calculated.
   return(rates_total);
  }
//+------------------------------------------------------------------+
【表示結果】
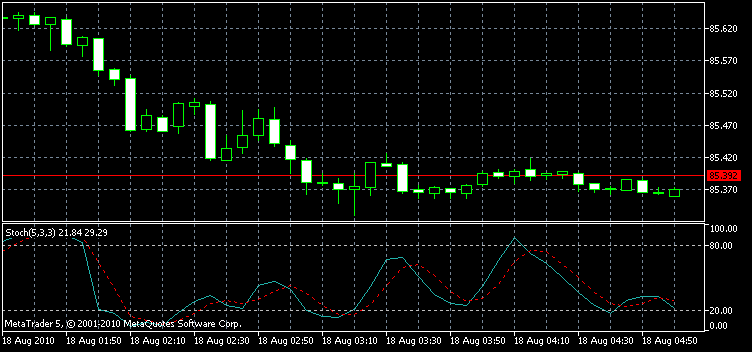
%Kの期間5、%Dの期間3。 薄緑(K), 赤(D)、前半のトレンド時はダメですが、後半のレンジ相場のときは有効のようです。
Back to Meta Trader