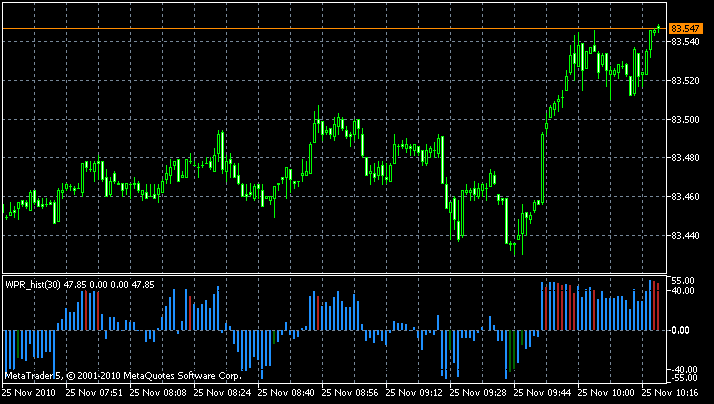
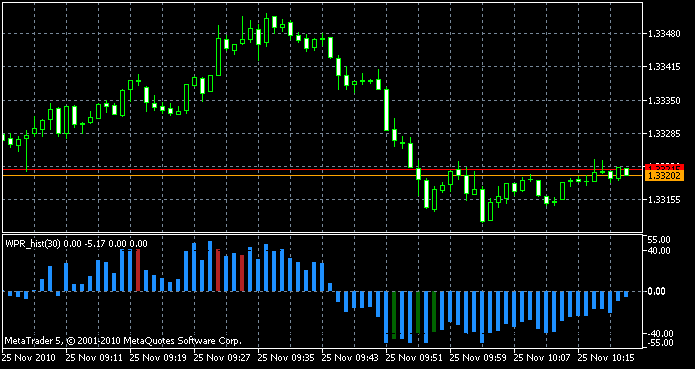
【解説】【MQL5 community】 William's Percent Range Histogram : William's Percent Range をHistogramで表示したものである。
これはレンジ相場の時に有効といわれ、買われ過ぎ、売られ過ぎを判断する指標である。 これはストキャスティクスを改良したもので、 ストキャスティクスの%Kの部分の最安値を最高値に置き換えたものです。
【計算法】
−100×(N期間の最高値ー現在の価格)/(N期間の最高値−N期間の最安値)
【シグナル】
ヒストグラムが「緑」ときは、「買い」、ヒストグラムが「赤い」ときは、「売り」。
//+------------------------------------------------------------------+
//|                                                WPR_Hist.mq5 |
//|                        Copyright 2010, MetaQuotes Software Corp. |
//|                                              http://www.mql5.com |
//+------------------------------------------------------------------+
#property copyright "Copyright 2010, MetaQuotes Software Corp."
#property link      "http://www.mql5.com"
#property version   "1.00"
#property indicator_separate_window
#property indicator_minimum -55
#property indicator_maximum 55
#property indicator_buffers 4
#property indicator_plots   4
//--- plot indicator_color1
#property indicator_label1  "indicator_color1"
#property indicator_type1   DRAW_HISTOGRAM
#property indicator_color1  DodgerBlue
#property indicator_style1  STYLE_SOLID
#property indicator_width1  3
//--- plot indicator_color2
#property indicator_label2  "indicator_color2"
#property indicator_type2   DRAW_HISTOGRAM
#property indicator_color2  DodgerBlue
#property indicator_style2  STYLE_SOLID
#property indicator_width2  3
//--- plot indicator_color3
#property indicator_label3  "indicator_color3"
#property indicator_type3   DRAW_HISTOGRAM
#property indicator_color3  DarkGreen
#property indicator_style3  STYLE_SOLID
#property indicator_width3  3
//--- plot indicator_color4
#property indicator_label4  "indicator_color4"
#property indicator_type4   DRAW_HISTOGRAM
#property indicator_color4  FireBrick
#property indicator_style4  STYLE_SOLID
#property indicator_width4  3

#property indicator_level1 0
#property indicator_level2 40
#property indicator_level3 -40
#property indicator_levelcolor Black
//--- input parameters
input int InpWPRPeriod=30; // Period
//--- indicator buffers
double ExtWPRBuffer1[];
double ExtWPRBuffer2[];
double ExtWPRLongBuffer1[];
double ExtWPRShortBuffer1[];
//--- global variables
int       ExtWPRPeriod;
//+------------------------------------------------------------------+
//| Custom indicator initialization function                         |
//+------------------------------------------------------------------+
void OnInit()
  {
//--- check for input value
   if(InpWPRPeriod<3)
     {
      ExtWPRPeriod=30;
      Print("Incorrect InpWPRPeriod value. Indicator will use value=",ExtWPRPeriod);
     }
   else ExtWPRPeriod=InpWPRPeriod;
//---- name for DataWindow and indicator subwindow label
   IndicatorSetString(INDICATOR_SHORTNAME,"WPR_hist"+"("+string(ExtWPRPeriod)+")");
   PlotIndexSetString(0,PLOT_LABEL,"up");
   PlotIndexSetString(1,PLOT_LABEL,"down");
   PlotIndexSetString(2,PLOT_LABEL,"long");
   PlotIndexSetString(3,PLOT_LABEL,"short");
//---- indicator's buffer
   SetIndexBuffer(0,ExtWPRBuffer1);
   SetIndexBuffer(1,ExtWPRBuffer2);
   SetIndexBuffer(2,ExtWPRLongBuffer1);
   SetIndexBuffer(3,ExtWPRShortBuffer1);
   PlotIndexSetInteger(0,PLOT_DRAW_BEGIN,ExtWPRPeriod-1);
  //--- digits
   IndicatorSetInteger(INDICATOR_DIGITS,2);
//----
  }
//+------------------------------------------------------------------+
//| Custom indicator iteration function                              |
//+------------------------------------------------------------------+
int OnCalculate(const int rates_total,
                const int prev_calculated,
                const datetime& Time[],
                const double& Open[],
                const double& High[],
                const double& Low[],
                const double& Close[],
                const long& tick_volume[],
                const long& volume[],
                const int& spread[])
   {
//---- insufficient data
   if(rates_total<ExtWPRPeriod)
      return(0);
//--- start working
   int i=prev_calculated-1;
//--- correct position
   if(i<ExtWPRPeriod-1) i=ExtWPRPeriod-1;

   double upperShadow, lowerShadow, body;

//---  main cycle
   while(i<rates_total)
     {
      //--- calculate maximum High
      double dMaxHigh=MaxAr(High,ExtWPRPeriod,i);
      //--- calculate minimum Low
      double dMinLow=MinAr(Low,ExtWPRPeriod,i);
      //--- calculate WPR
      if(dMaxHigh!=dMinLow)

      {
           double val = 100*(dMaxHigh - Close[i]) / (dMaxHigh - dMinLow);

           ExtWPRLongBuffer1[i] = 0;

           if( val <= 50 ) { ExtWPRBuffer1[i] = -val+50; ExtWPRBuffer2[i] = 0; } else { ExtWPRBuffer1[i] = 0; ExtWPRBuffer2[i] = -val+50; }

           if(Close[i]<=Open[i] )
           {
            lowerShadow = Close[i]-Low[i];
            upperShadow = High[i]-Open[i];
            body = Open[i]-Close[i];
           }

           if(Close[i]>=Open[i] )
           {
            lowerShadow = Open[i]-Low[i];
            upperShadow = High[i]-Close[i];
            body = Close[i]-Open[i];
           }

           if( (ExtWPRBuffer2[i-1] < ExtWPRBuffer2[i]) && (Low[i] <= dMinLow) && ((Low[i] < Low[i-1]) || (Close[i] > Open[i])) && (lowerShadow >= 0)  )
           {
            ExtWPRLongBuffer1[i] = ExtWPRBuffer2[i];
           }
           else
           if( (ExtWPRBuffer1[i-1] > ExtWPRBuffer1[i]) && (High[i] >= dMaxHigh) && (High[i] > High[i-1]) && (upperShadow >= 0) )
           {
            ExtWPRShortBuffer1[i] = ExtWPRBuffer1[i];
           }
           else
           {
            ExtWPRLongBuffer1[i] = 0;
            ExtWPRShortBuffer1[i] = 0;
           }
        }
        i++;
     }
   //--- return new prev_calculated value
   return(rates_total);
  }
//+------------------------------------------------------------------+
//| Maximum High                                                     |
//+------------------------------------------------------------------+
double MaxAr(const double &array[],int period,int cur_position)
  {
   double Highest=array[cur_position];
   for(int i=cur_position-1;i>cur_position-period;i--)
     {
      if(Highest<array[i]) Highest=array[i];
     }
   return(Highest);
  }
//+------------------------------------------------------------------+
//| Minimum Low                                                      |
//+------------------------------------------------------------------+
double MinAr(const double &array[],int period,int cur_position)
  {
   double Lowest=array[cur_position];
   for(int i=cur_position-1;i>cur_position-period;i--)
     {
      if(Lowest>array[i]) Lowest=array[i];
     }
   return(Lowest);
  }
//+------------------------------------------------------------------+


【表示結果】


Back to Meta Trader


