


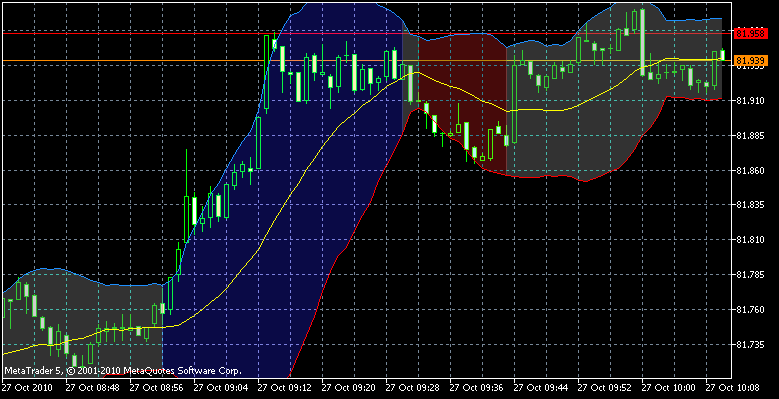
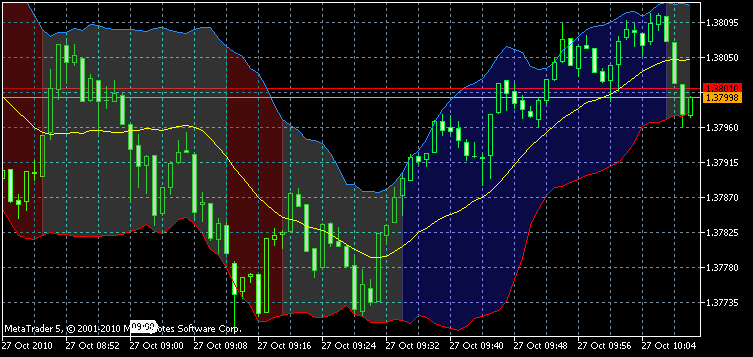
【解説】【MQL5 community】 iBBFill : Bollinger Bands に色彩的な要素を付け加えたもの。 元来、Bollinger Bandsは 相場の変動幅を正規分布に従うものとし、分布の大半が収まるだけの乖離幅を算出。 チャート上に3本のラインが表示され、移動平均から上下にそれぞれ2標準偏差離れたものをラインとして表示。
これにロウソク足が、上の線を超えると、雲が青色に表示され、 逆に下の線を超えると茶色となる。 その他はグレイのまま。
【計算法】
標準偏差(σ=√(n×n日間の終値の2乗の合計−n日間の終値の合計の2乗)/(期間×(期間−1)))を計算すればよい。
±1σライン・・・移動平均線の数値±標準偏差、
±2σライン・・・移動平均線の数値±2×標準偏差、
±3σライン・・・移動平均線の数値±3×標準偏差
※移動平均線及び標準偏差に用いる期間は9日、20日、25日などが用いられています。
またデータが正規分布している場合、以下の確率で価格は収まる。
移動平均線±1σ以内・・・68.27%、
移動平均線±2σ以内・・・95.45%、
移動平均線±3σ以内・・・99.73%
【シグナル】
【レンジ相場】 「売りシグナル」・・・+2σのボリンジャー・バンド移動平均線にローソク足チャートが接触、もしくはそのまま上抜けした場合、真ん中の移動平均線まで価格が戻ることが多い。
「買いシグナル」・・・-2σのボリンジャー・バンド移動平均線にローソク足チャートが接触、もしくはそのまま下抜けした場合、真ん中の移動平均線まで価格が戻ることが多い。
特に±2σを利用した場合は、95%以上の高確率で真ん中の移動平均に戻ってくる。 ただし価格の変動がランダムウォークという前提がある。
【(レンジ相場から)トレンド相場への転換】 上下移動平均線の動きによるバンドの収縮状況を見る。 上下移動平均線が接近し始め、バンドの収縮が始まり(レンジ相場へ)、その後に一方向へバンドを抜けた時点を売り・買いのシグナルと見る。つまりトレンド相場への転換。
上抜けした場合は、「買い」のシグナル、
下抜けした場合は、「売り」のシグナル。
//+------------------------------------------------------------------+
//|                                                      iBBFill.mq5 |
//|                                                Copyright Integer |
//|                                                 http://dmffx.com |
//+------------------------------------------------------------------+
#property copyright "Integer"
#property link      "http://dmffx.com"
#property version   "1.00"
#property indicator_chart_window
#property indicator_buffers 10
#property indicator_plots   6
//--- plot Label1
#property indicator_label1  "UpTrend"
#property indicator_type1   DRAW_FILLING
#property indicator_color1  C'10,10,70'
#property indicator_style1  STYLE_SOLID
#property indicator_width1  1
//--- plot Label2
#property indicator_label2  "DnTrend"
#property indicator_type2   DRAW_FILLING
#property indicator_color2  C'70,10,10'
#property indicator_style2  STYLE_SOLID
#property indicator_width2  1

//--- plot Label2
#property indicator_label3  "Flat"
#property indicator_type3   DRAW_FILLING
#property indicator_color3  C'50,50,50'
#property indicator_style3  STYLE_SOLID
#property indicator_width3  1

#property indicator_label4  "BB MA"
#property indicator_type4   DRAW_LINE
#property indicator_color4  Yellow
#property indicator_style4  STYLE_SOLID
#property indicator_width4  1

#property indicator_label5  "BB Upper"
#property indicator_type5   DRAW_LINE
#property indicator_color5  DodgerBlue
#property indicator_style5  STYLE_SOLID
#property indicator_width5  1

#property indicator_label6  "BB Lower"
#property indicator_type6   DRAW_LINE
#property indicator_color6  Red
#property indicator_style6  STYLE_SOLID
#property indicator_width4  1


//--- input parameters
// Bollinger Bands Period
input int                              BBPeriod=20;
// Bollinger Bands Width
input double                           BBDeviation=2;
// Bollinger Bands applied price
input ENUM_APPLIED_PRICE               BBPrice=PRICE_CLOSE;

//--- indicator buffers

double Upper1[];
double Lower1[];
double Upper2[];
double Lower2[];
double Upper3[];
double Lower3[];
double BCBuf[];
double BUBuf[];
double BLBuf[];

double Trend[];

int BBHand;
//+------------------------------------------------------------------+
//| Custom indicator initialization function                         |
//+------------------------------------------------------------------+
int OnInit()
  {

   SetIndexBuffer(0,Upper1,INDICATOR_DATA);
   SetIndexBuffer(1,Lower1,INDICATOR_CALCULATIONS);

   SetIndexBuffer(2,Upper2,INDICATOR_DATA);
   SetIndexBuffer(3,Lower2,INDICATOR_CALCULATIONS);

   SetIndexBuffer(4,Upper3,INDICATOR_DATA);
   SetIndexBuffer(5,Lower3,INDICATOR_CALCULATIONS);

   SetIndexBuffer(6,BCBuf,INDICATOR_DATA);
   SetIndexBuffer(7,BUBuf,INDICATOR_DATA);
   SetIndexBuffer(8,BLBuf,INDICATOR_DATA);

   SetIndexBuffer(9,Trend,INDICATOR_CALCULATIONS);

   BBHand=iBands(NULL,PERIOD_CURRENT,BBPeriod,0,BBDeviation,BBPrice);

   return(0);
  }
//+------------------------------------------------------------------+
//| Custom indicator iteration function                              |
//+------------------------------------------------------------------+
int OnCalculate(const int rates_total,
                const int prev_calculated,
                const datetime &time[],
                const double &open[],
                const double &high[],
                const double &low[],
                const double &close[],
                const long &tick_volume[],
                const long &volume[],
                const int &spread[])
  {
   int limit,limit1,limit2;
   if(prev_calculated>0)
     {
      limit=prev_calculated-1;
      limit=limit;
     }
   else
     {
      limit=0;
      limit1=1;
     }

   CopyBuffer(BBHand,0,0,rates_total-limit,BCBuf);
   CopyBuffer(BBHand,1,0,rates_total-limit,BUBuf);
   CopyBuffer(BBHand,2,0,rates_total-limit,BLBuf);

   for(int i=limit1;i<rates_total;i++)
     {
      Trend[i]=Trend[i-1];
      Upper1[i]=0;
      Lower1[i]=0;
      Upper2[i]=0;
      Lower2[i]=0;
      Upper3[i]=0;
      Lower3[i]=0;

      if(Trend[i]==1 && close[i]<BCBuf[i])
        {
         Trend[i]=0;
        }
      if(Trend[i]==-1 && close[i]>BCBuf[i])
        {
         Trend[i]=0;
        }

      if(close[i]>BUBuf[i])
        {
         Trend[i]=1;
        }
      if(close[i]<BLBuf[i])
        {
         Trend[i]=-1;
        }

      switch((int)Trend[i])
        {
         case 1:
            Upper1[i]=BUBuf[i];
            Lower1[i]=BLBuf[i];
            if(Trend[i-1]!=1)
              {
               Upper1[i-1]=BUBuf[i-1];
               Lower1[i-1]=BLBuf[i-1];
              }
            break;
         case -1:
            Upper2[i]=BUBuf[i];
            Lower2[i]=BLBuf[i];
            if(Trend[i-1]!=-1)
              {
               Upper2[i-1]=BUBuf[i-1];
               Lower2[i-1]=BLBuf[i-1];
              }
            break;
         case 0:
            Upper3[i]=BUBuf[i];
            Lower3[i]=BLBuf[i];
            if(Trend[i-1]!=0)
              {
               Upper3[i-1]=BUBuf[i-1];
               Lower3[i-1]=BLBuf[i-1];
              }
            break;
        }

     }
   return(rates_total);
  }
//+------------------------------------------------------------------+


【表示結果】


Back to Meta Trader